Bitcoin Price Prediction: BTC/USD Encounters Significant Reverses

Bitcoin Price Prediction – May 29
The BTC/USD market now encounters significant reverses after a strive of embarking on a rallying movement it made recently. The crypto-financial record as of the time of writing has it that the market value trades at about a -1.79% reduction around the level of $35,134.
BTC/USD Market
Key Levels:
Resistance levels: $40,000, $45,000, $50,000
Support levels: $30,000, $25,000, $20,000
BTC/USD – Daily Chart
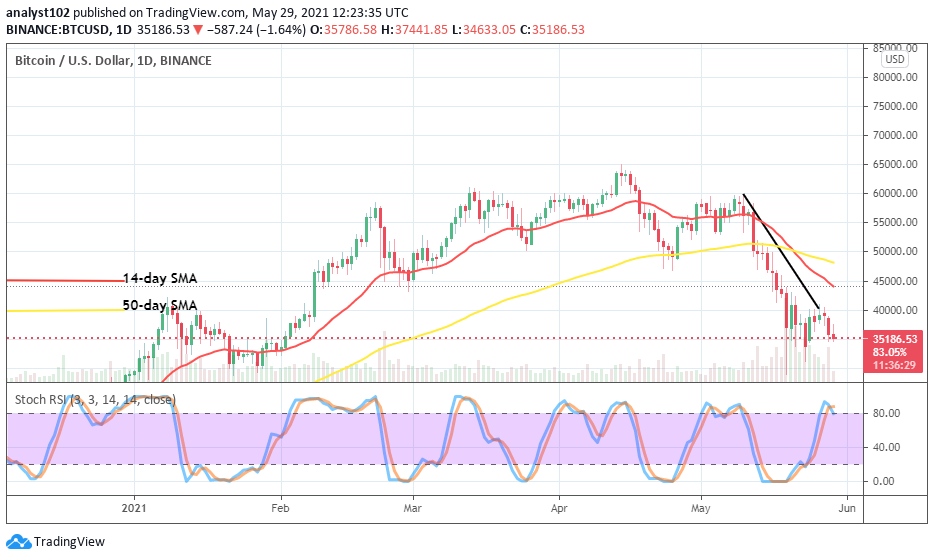
After a line of about three days’ sessions of price converging close below the key resistance point of $40,000 between May 25 and 27. The subsequent activities until the present have been witnessing major fall-offs on a higher note while it lost momentum to break past the resistance line. The bearish trend-line still drew gone across downward the two SMAs to place a strong mark at the immediate resistance level. The 14-day SMA trend-line is underneath the 50-day SMA indicator. The Stochastic Oscillators have crossed the hairs from the overbought region to point slightly downward near range 80. The shows that the US fiat currency has potentially again begun to push the crypto market for more downs in the near time.
The BTC/USD market encounters significant reverses; will it be heightened than before?
The crypto price encounters significant reverses are most liable to seeing more downs Judging the next potential draw-down in the market operations of Bitcoin pairing with the US Dollar by what the Stochastic Oscillators’ reading has signaled more downsides are imminent in the near time. Intensification of downward forces as of the present time of trading will most likely put bulls on hold until a successful breakdown of the lower level of $35,000 is achieved. A price strong resurfacing below that point will possibly allow a return of energy back into the crypto economy.
Keeping the recent downtrend in a continuous moving manner, bears have again proven their stance in the market against the recent rebounding efforts made so far by the base trading instrument. It is highly expected that the level of $35,000 will be breached to the south to either revisit previous lower support or a bit lower toward the line of $25,000 afterward. However, bulls are enjoined to be on the lookout for what price will throwback during further downward depressions between $35,000 and $25,000 may in the long run.
BTC/USD 4-hour Chart
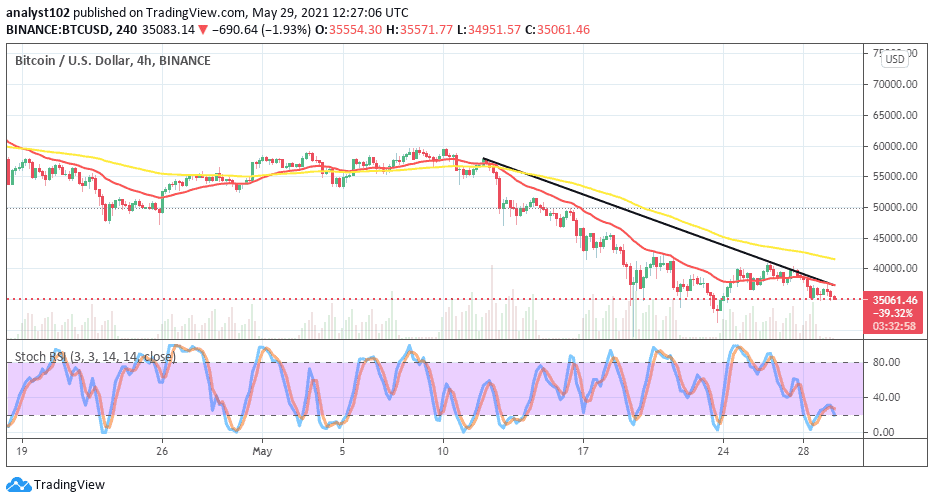
The market valuation of BTC/USD has continued is still clearly depicted a complete bearish trading situation. About three different points in time, it is depicted on the medium-term chart that the BTC/USD trade encounters significant reverses. The crypto’s price now trades below the sell signal side of the SMAs. The Stochastic Oscillators have crossed the hairs toward the south a bit over range 20 to suggest featuring more downs in the next sessions. However, bearish traders need to beware of late entry to avoid getting being whipsawed eventually.


