Bitcoin Price Prediction: BTC/USD Price Averages the $40,000 Resistance
Bitcoin Price Prediction – June 14
The market operation involving Bitcoin and the US Dollar now averages the $40,000 immediate resistance and the upper range trading zone. In the process of that scenario, the crypto’s price now trades around $39,222 level at a rate of about -0.05%.
BTC/USD Market
Key Levels:
Resistance levels: $40,000, $45,000, $50,000
Support levels: $35,000, $30,000, $25,000
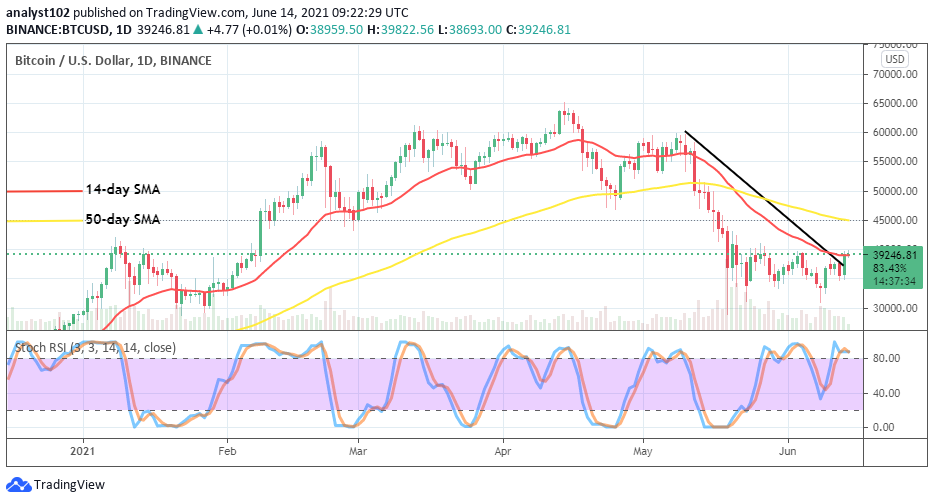
BTC/USD – Daily Chart
Despite featuring notable falls and rises in the crypto economy, the BTC/USD daily chart yet displays that the crypto’s price averages the $40,000 resistance level. Both the smaller SMA and the bearish trend lines are positioned slightly below the resistance point. The 50-day SMA indicator is located over the 14-day SMA trend-line. The Stochastic Oscillators are in the overbought region with closed lines in an attempt to cross toward the north.
Could there be a breakout soon in the BTC/USD market as the price averages the $40,000 resistance?
A breakout of the $40,000 resistance level needed to come to past in the market operations featuring between Bitcoin and the US Dollar as price averages the $40,000 resistance level. However, the Stochastic Oscillators seem to close their lines in a bid to signal a consolidation moving manner. And, that could lead the crypto economy into gaining more upsides if price holds for long in such a moving style. But, a strong reversion may cause invalidation of that sentiment.
On the downside, the points between the $40,000 resistance and the penultimate resistance level of $45,000 are still believed to be the areas of entry–getting for bears. The featuring of the Stochastic Oscillators currently in the overbought region suggests that the launching of long trading positions may be suspended for a while. A pull-up against that level that eventually allows a reversal move may in that way portend a return of downward movement in the range-bound areas of $40,000 and $35,000.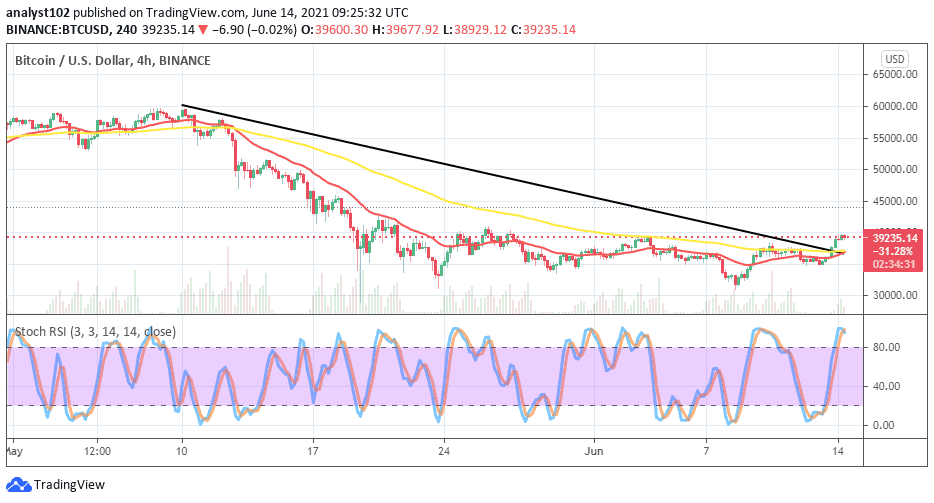
BTC/USD 4-hour Chart
There is a slight breakout of the indicators as is shown on the BTC/USD medium-term chart. The 50-day SMA is located over the 14-day SMA. The bearish trend-line drew downward from the above to place alongside at a point where the two SMAs have conjoined below the current trading zone of the crypto market. The Stochastic Oscillators are in the overbought with closed lines to signal a pause in the crypto trading activities. All in all, it still believed that the more the market dips below the $40,000 the better the chance of getting a valuable reversal pattern that could suit buy entry afterward.
Looking to buy or trade Bitcoin (BTC) now? Invest at eToro!
75% of retail investor accounts lose money when trading CFDs with this provider