Bitcoin Price Prediction: BTC/USD Price Plummets Below $36,000

Bitcoin Price Prediction – June 12
The Bitcoin price is spreading the bearish move to areas just below $35,000 after numerous attempts to hold gains above $37,500.
BTC/USD Long-term Trend: Bearish (Daily Chart)
Key levels:
Resistance Levels: $42,000, $44,000, $46,000
Support Levels: $30,000, $28,000, $26,000
BTC/USD falls below $37,448 as the largest cryptocurrency embarked on a support smashing exercise after failing to hold above $37,000 following a significant breakout in the last few days. Therefore, the bearish control is seen across the market with other major digital assets posting similar losses as they trade below the 9-day and 21-day moving averages.
Bitcoin Price Prediction: Can BTC Price Go Lower?
The Bitcoin price is trading at $38,825 with an intraday loss of 4.05%. The prevailing trend is bearish with expanding volatility. However, the first digital asset is currently consolidating in a bearish flag pattern. Meanwhile, a breakout in this pattern in the direction of the previous trend is expected to continue. In this case, BTC/USD is expected to drop and stay below 9-day and 21-day moving averages and could move towards the critical support levels at $30,000, $28,000, and $26,000.
However, if the Bitcoin price stays above the moving averages; the price could rise to $38,000 vital resistance. Therefore, a further bullish drive could push the price to $42,000, $44,000, and $46,000 resistance levels. The technical indicator Relative Strength Index (14) is moving below 45-level, which shows a possible more bearish momentum may continue to play out.
BTC/USD Medium – Term Trend: Ranging (4H Chart)
At the opening of the market today, the Bitcoin price first went up but dropped slightly within 24 hours, bringing its price from $37,448 to reach around $35,790. Should the price continue to drop below the 9-day and 21-day moving averages, it could reach the nearest support level at $33,000 and below.
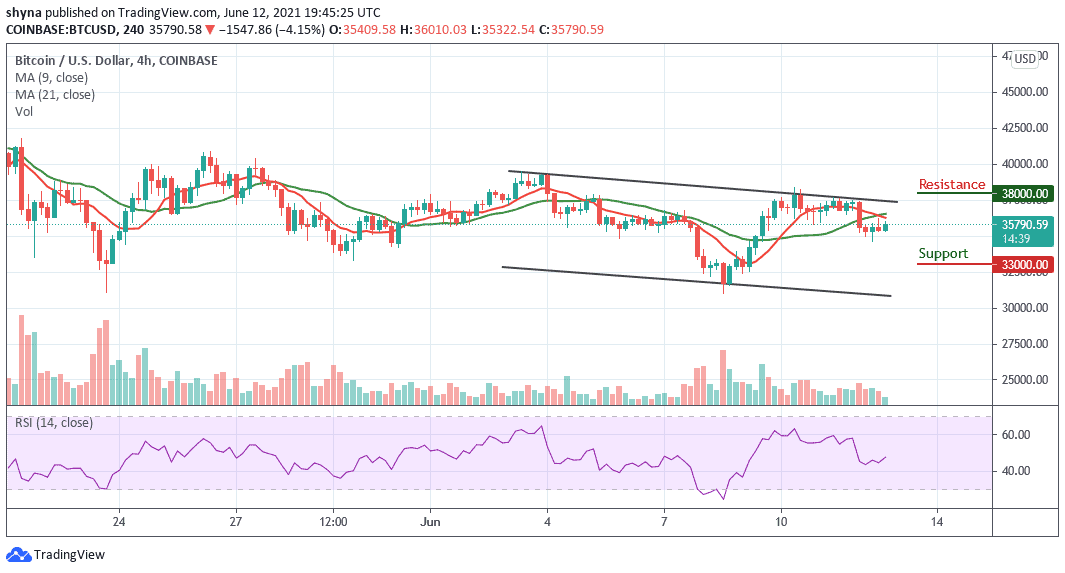
However, should in case the bulls push the coin above the upper boundary of the channel, the Bitcoin price could reach the potential resistance level of $38,000 and above. Presently, the market may continue to move sideways or experience an uptrend as the Relative Strength Index (14) indicator moves above 45-level.
Looking to buy or trade Bitcoin (BTC) now? Invest at eToro!
75% of retail investor accounts lose money when trading CFDs with this provider