Bitcoin Price Prediction: BTC/USD Price Stables Above $36,500

Bitcoin Price Prediction – June 9
The Bitcoin price is trading nicely above the $36,350 and the coin must climb above the $9,500 resistance to continue higher.
BTC/USD Long-term Trend: Bearish (Daily Chart)
Key levels:
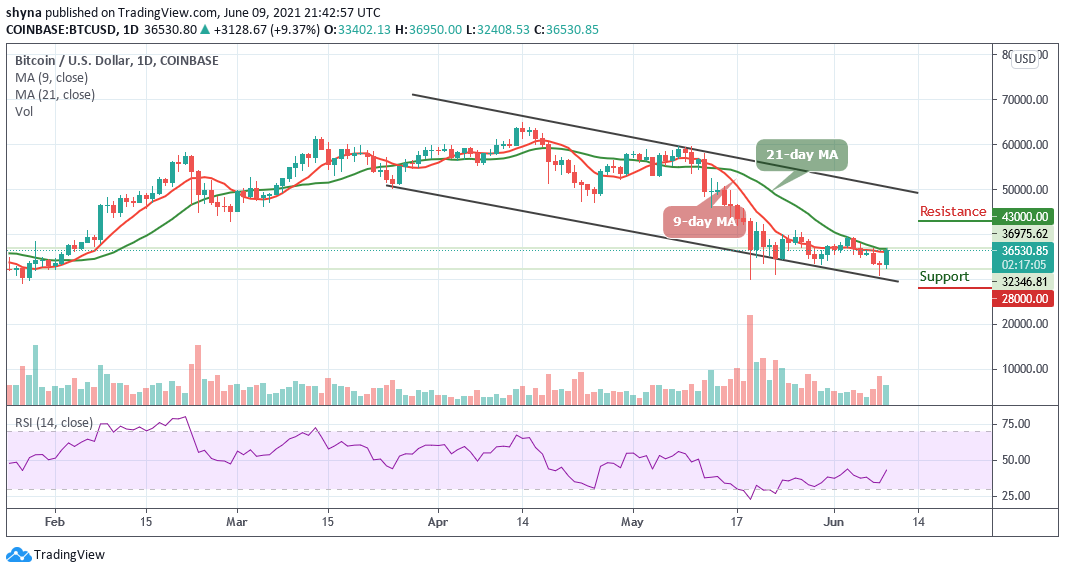
Resistance Levels: $43,000, $45,000, $47,000
Support Levels: $28,000, $25,000, $22,900
BTC/USD begins to improve today, although many coins are following the footstep of Bitcoin as well. The Bitcoin price also reflected a similar movement as the coin improve in price movement at the moment. Within the first few hours of today’s trading, BTC/USD could have moved up from $32,408 to $36,950 and now $36,530.
Bitcoin Price Prediction: Ready to Move Higher?
The Bitcoin price is yet to cross above the 9-day and 21-day moving average as the pair may be settling in a tight range between $32,000 and $38,000 below the 9-day and 21-day moving averages. In addition, this current session is seeing Bitcoin and other major cryptos exchanging in a good tone.
However, the Bitcoin price and the daily candle are trading at $36,530 below the 9-day and 21-day moving averages. The next resistance levels lies at $43,000, $45,000, and $47,000. However, if the Bitcoin price failed to cross above the 9-day and 21-day MAs; we may see a price cut to break below the channel at $30,000 vital support. Therefore, a further low drive could send the price to $28,000, $26,000, and $24,000 supports. For now, the Relative Strength Index (14) is moving above 40-level, suggesting more bullish signals into the market.
Looking to buy or trade Bitcoin (BTC) now? Invest at eToro!
75% of retail investor accounts lose money when trading CFDs with this provider
BTC/USD Medium-Term Trend: Ranging (4H Chart)
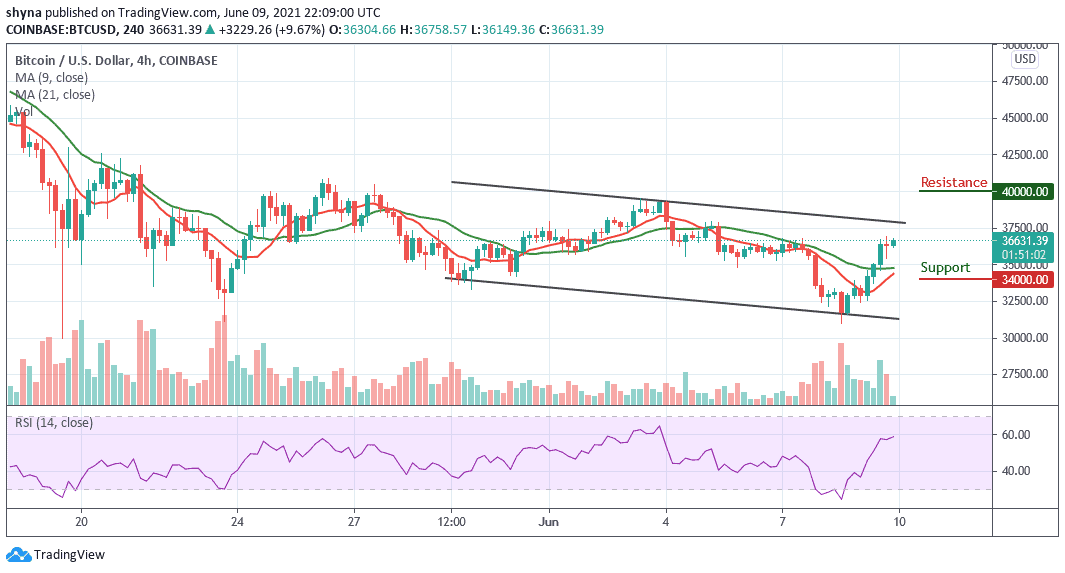
Looking at the chart, BTC/USD is clearly facing a lot of resistance near the $36,700 and $36,800 levels. A successful close above the $37,000 level is a must for bullish acceleration. If not, there is a risk of a downside extension below the $35,000 support. If there is a downward move, initial support is near the $34,000 level and the main support is near the $32,000 level, below which there is a risk of another decline towards $30,000.

Furthermore, if there are more gains, the $36,500 level is likely to act as a major hurdle in the near term for Bitcoin. So if there is an upside break above the $37,000 resistance, the next stop for the bulls may perhaps be near the $40,000 and above as the Relative Strength Index (14) is likely to move above 60-level, which indicates that additional bullish trends may come into play.
Looking to buy or trade Bitcoin (BTC) now? Invest at eToro!
75% of retail investor accounts lose money when trading CFDs with this provider


