Bitcoin Price Prediction: BTC/USD Ready to Break $40,000

Bitcoin Price Prediction – June 2
The Bitcoin price bounces off the support at $35,920 and added more than $2500 to its current value.
BTC/USD Long-term Trend: Bearish (Daily Chart)
Key levels:
Resistance Levels: $42,000, $44,000, $46,000
Support Levels: $32,000, $30,000, $28,000
BTC/USD is currently trading around $38,182 with a 4.07% gain in the past 24-hour. According to the daily chart, the Bitcoin price is fighting to stay above the important level of $38,000 as it crosses above the 9-day moving average. However, for BTC/USD to remain above this level for the next few days, the bulls need to make the $35,000 support level to be pretty strong.
Bitcoin Price Prediction: Could Bitcoin (BTC) Break Higher?
Since a couple of days ago, BTC/USD has been maintaining little upward movement, and if the first digital asset breaks above the 21-day moving average, it could touch the nearest resistance level of $40,000. Moreover, Bitcoin (BTC) needs to reclaim this important resistance level to head upwards. If successful, the primary cryptocurrency could therefore aim at $42,000, followed by $44,000, and $46,000 resistance levels.
However, looking at the Relative Strength Index (14) in the daily range, one may conclude that BTC/USD is done with the downside. Meanwhile, on the upside, recovery may not come easy and traders must be aware that support will have to be sort above $38,000 while other important zones to keep in mind are around $42,000, $44,000, and $46,000 resistance levels.
Nevertheless, despite the current movement, the RSI (14) is yet to cross above the 50-level which means that there may still be a room that could be explored by the bears. If this happens, the supports at $32,000, $30,000, and $28,000 may play out.
BTC/USD Medium – Term Trend: Ranging (4H Chart)
From a technical point of view, on the 4-hour chart, the technical indicator Relative Strength Index (14) keeps moving upward and ready to cross above 60-level. Meanwhile, for this to come to play there is a little bit of bullish divergence on the technical indicator as the signal line faces the north.
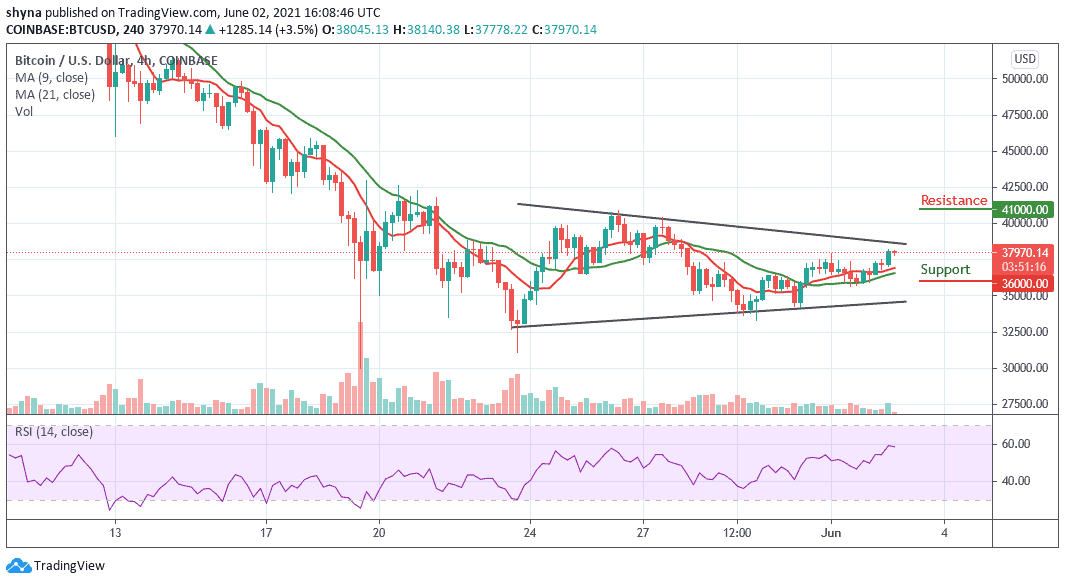
However, if the Bitcoin price breaks above the upper boundary of the channel, the market price may likely reach the resistance at $41,000 and above. On the contrary, if the current market value drops below the 9-day and 21-day moving averages, it may likely touch the supports at $36,000 and below.