Bitcoin Price Prediction: BTC/USD Stays Around $42,000 Level

Bitcoin Price Prediction – February 14
The Bitcoin price prediction may begin to follow the sideways movement as the coin trades around the resistance level of $42,000.
BTC/USD Long-term Trend: Bearish (Daily Chart)
Key levels:
Resistance Levels: $48,000, $50,000, $52,000
Support Levels: $37,000, $35,000, $33,000
BTC/USD is likely to experience another unexpected selloff if the Bitcoin price crosses below the 21-day moving average. Today, the Bitcoin price drops slightly to touch the support of $41,570 after touching the daily high of $41,876. However, a reversal could play out if the king coin trades above the 9-day moving average, and this may send BTC/USD above the upper boundary of the channel.
Bitcoin Price Prediction: Bitcoin Price May Consolidate
The technical indicator Relative Strength Index (14) reveals that the Bitcoin price is consolidating above 50-level, and any drop below this level could lead the coin to cross below the 21-day moving averages. However, the technical indicator Relative Strength Index (14) may trade sideways as the signal line moves in the same direction above 50-level.
On the upside, recovery may not come now but any attempt to cross above the upper boundary of the channel could push the coin to the resistance levels of $48,000, $50,000, and $52,000 respectively. On the contrary, any bearish movement below the 21-day moving average may force the Bitcoin price to reach the support levels at $37,000, $35,000, and $33,000.
BTC/USD Medium-Term Trend: Ranging (4H Chart)
On the 4-hour chart, the Bitcoin price is hovering below the 9-day and 21-day moving averages. The chart reveals that the coin touches the support level of $42,002 as the market prepares to move sideways. However, BTC/USD is likely to follow the bearish movement if the coin crosses below the lower boundary of the channel. Therefore, critical support could be located at $40,000 and below.
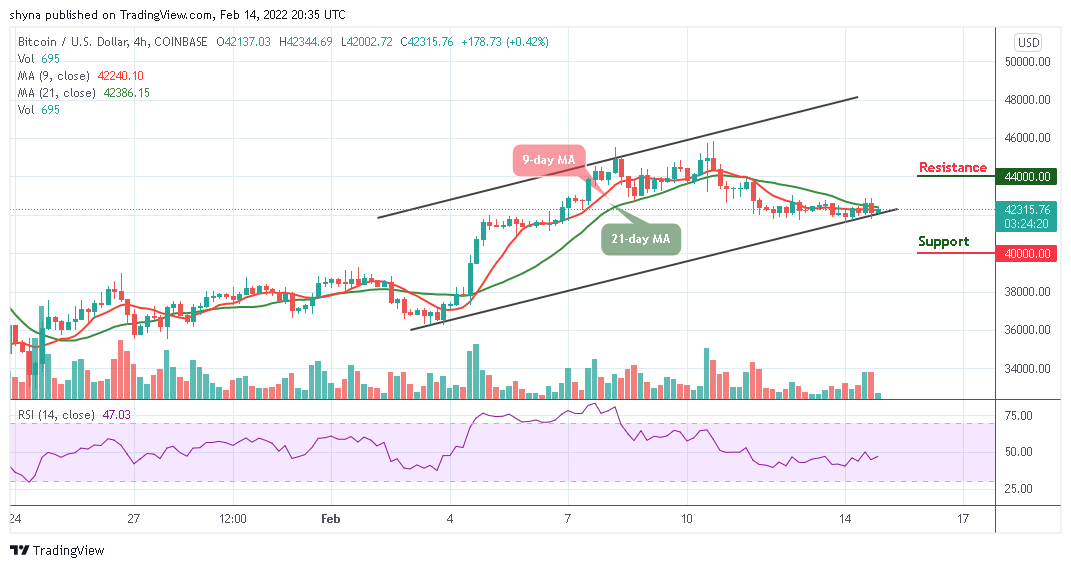
Moreover, if the price bounce back above the 9-day and 21-day moving averages and head to the upside, the Bitcoin price may reach the resistance level of $44,000 and above. Now, as the technical indicator Relative Strength Index (14) crosses above 50-level, the king coin is likely to experience a slight bullish movement.
Looking to buy or trade Bitcoin (BTC) now? Invest at eToro!
68% of retail investor accounts lose money when trading CFDs with this provider
Read more: