Bitcoin Price Prediction for Today, June 16: BTC May Move Down More

Bitcoin Price Prediction – June 16
The gravity of falling forces that have dominated the BTC/USD market has not appeared running into give a damn as the crypto economy tends to move down more in the present downward trending motion. It’s necessary to recall the all-time high value of the market stands at $68,789.63 in the last seven months. And in the past nine years, the all-time low is $65.53. The percent of the return on investment stands at 15,542.05 positives.
Bitcoin (BTC) Statistics:
BTC price now – $21,216.88
BTC market cap – $403.5 billion
BTC circulating supply – 19.1 million
BTC total supply – 19.1 million
Coinmarketcap ranking – #1
BTC/USD Market
Key Levels:
Resistance levels: $25,000, $27,500, $30,000
Support levels: $20,000, $17,500, $15,000
BTC/USD – Daily Chart
The daily chart reveals the BTC/USD market tends to move down more if the price has to consolidate near the $20,000 support level in the long-term run. The SMA trend lines are far above the current trading spot. The 50-day SMA indicator is above the 14-day SMA indicator. The Stochastic Oscillators are in the oversold region with their lines conjoined within. That portends a falling force is playing out currently.
Will the BTC/USD market operation get going down more soon?
The emergence of a bearish candlestick needed to occur against the $20,000 support level to form a selling wall to the candlesticks to affirm the continuity of the bearish trend, as the headline suggests the BTC/USD market tends to move down more. A rebounding motion shouldn’t as well be overruled in no time in the market, especially while the price has exhausted the force to the downside. Long-position placers needed to use a smaller time frame to detect an early buying entry.
On the downside of the technical analysis, the BTC/USD market sellers now have to keep a tough-barrier trading line between the $22,500 and $25,000 against either a rebound or a rallying motion against those points at a later session when the market tends to rebuild energy from a lower zone afterward. However, all that is obtainable in the market presently is that selling forces are still in top shape as there has been no bullish candlestick to signal a near end in the crypto’s falling movements.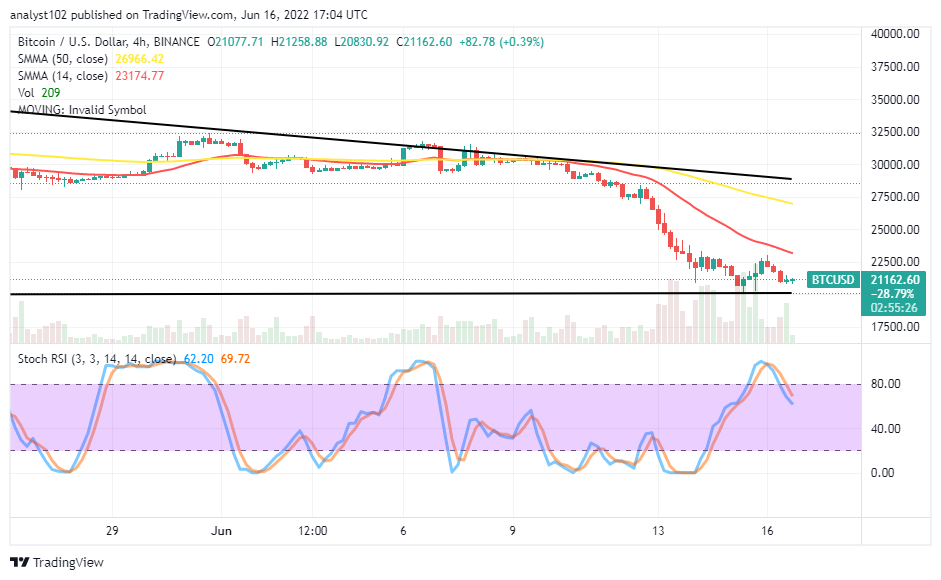
BTC/USD 4-hour Chart
The BTC/USD medium-term chart showcases the crypto trade tends to move down more underneath the trend line of the smaller SMA. The 14-day SMA indicator is beneath the 50-day SMA indicator. There is a separating space between the trading SMAs. The Stochastic Oscillators have crossed southbound from the oversold region to attempt closing and bending northbound around the 70 range line or thereabout. Price may go into a range-bound mode of trading in the value lines of $22,500 and $20,000 for some time before deciding on a specific direction to follow afterward.
Looking to buy or trade Bitcoin (BTC) now? Invest at eToro!
68% of retail investor accounts lose money when trading CFDs with this provider.
Read more: