Litecoin Price Prediction: LTC/USD Shows Sign of Weakness at $187

Litecoin Price Prediction – June 4
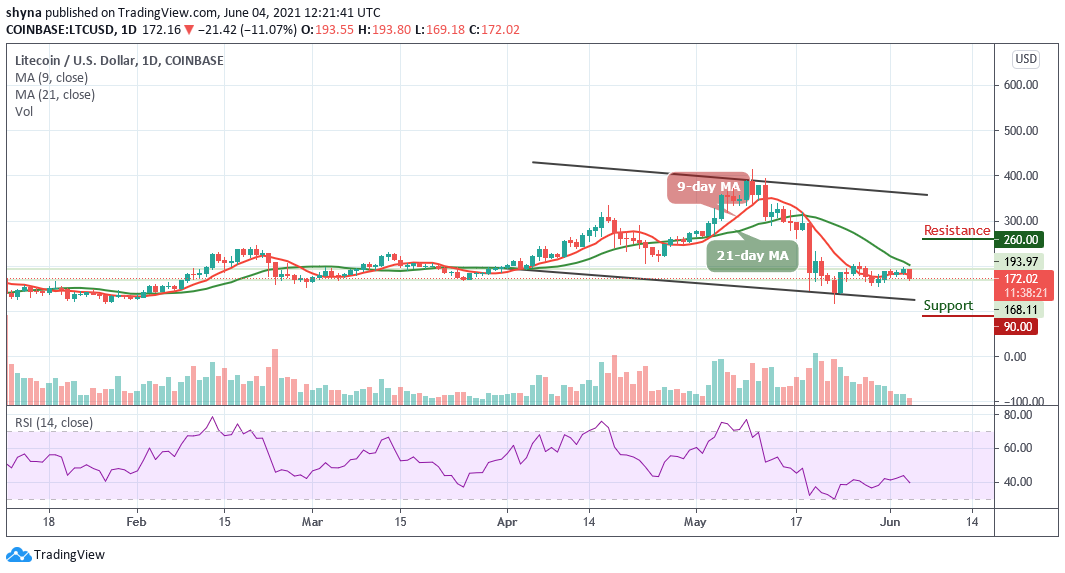
The Litecoin price is currently fighting to reclaim the $180 resistance level as the coin moves below the 9-day and 21-day moving averages.
LTC/USD Market
Key Levels:
Resistance levels: $260, $280, $300
Support levels: $90, $70, $50
LTC/USD opens today’s trade with the opening price of $193.55 as the coin is dropping like a stone towards $170 in a matter of hours. However, at the time of writing, the Litecoin price is changing hands at $172.02, seriously down by 11.07% after a rebound from the $175 level. Currently, the daily chart reveals that the technical indicator Relative Strength Index (14) is making an attempt to cross below 40-level, which means the coin could be vulnerable to further losses.
Litecoin Price Prediction: Will Litecoin sees a Further Downside?
According to the daily chart, if the sellers push the Litecoin price drops beneath $170, the next support lies below the lower boundary of the channel and a further downside may come to play out within the market in the negative moves. Moreover, if $100 support breaks, further support levels could be located at $90, $70, and $50 levels while the resistance levels to keep watch are $260, $280, and $300 should in case the Litecoin price crosses above the 9-day and 21-day moving averages.
Meanwhile, the technical indicator Relative Strength Index (14) is making an attempt to cross below 40-level, and if the market successfully crosses below the barrier, the increased bearish pressure could drive the Litecoin price towards the lower boundary of the channel. Moreover, the signal line could drop more and may look primed for another bearish crossover signal.
Against Bitcoin, we can see that the Litecoin price is following a downward movement. As the price falls, sellers are posing more threat for buyers to reach the support level of 0.03 BTC where the nearest target is located. However, any further bearish movement below the lower boundary of the channel may cause Litecoin to collapse.

Looking to buy or trade Litecoin (LTC) now? Invest at eToro!
75% of retail investor accounts lose money when trading CFDs with this provider
However, the continuation of the downtrend could hit the main support at 0.040 BTC before falling to 0.038 BTC and below. Meanwhile, the buyers may likely push the market above the 9-day and 21-day moving averages to reach the potential resistance at 0.060 BTC and above if a rebound plays out. The Relative Strength Index (14) is now focusing on the downside, indicating that the sellers may come to play.


