Which Cryptocurrency Will Explode June 2021 Week 3
The week started with cryptocurrencies turning green across the board, but which cryptocurrency will explode as the market sentiment turns more positive? We have the answers.
Bitcoin price led the lot by stepping above $40,000 on Monday, but the uptrend did not make it to $43,000. Ethereum’s price closed the gap to $2,700 before settling above $2,500.
Ether’s recoil was a significant move following last week’s support at $2,400. On the other hand, the international money transfer token Ripple continues with the consolidation between $0.8 and $0.9.
Some selected altcoins are no longer gasping for air in the wake of the previous week’s selloff. For instance, Polkadot price spiked over 15% to exchange hands around $26 before correcting to $24, while MATIC price spiked to $1.7 after adding over 15% to its value, according to the data by CoinGecko. Other tokens performing incredibly well include Amp (up 34%), Klaytn (up 12%), and Safemoon (up 15%).
As the week progresses, various crypto assets are expected to extend the bullish action. The list is extensive, but this article draws attention to Ethereum (ETH), Ripple (XRP), Aave (AAVE), and Binance Coin (BNB).
Ethereum Price Readies For Colossal 40% Upswing to $4,000
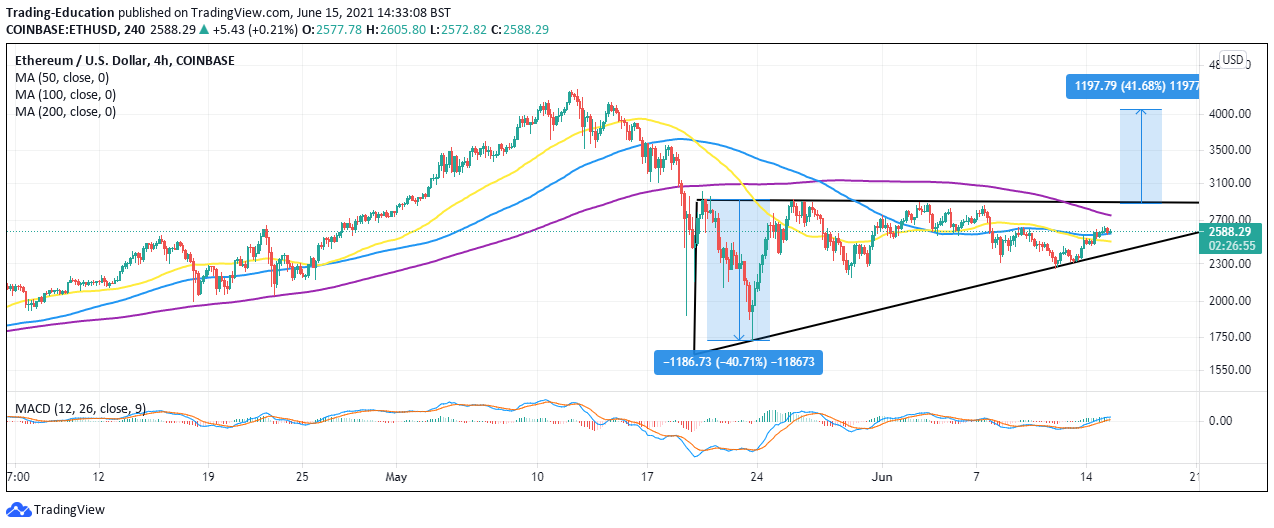
Ethereum price has lifted above several key levels since the beginning of the week, including the 50-day Simple Moving Average (SMA) on the four-hour chart, the 100 SMA, and $2,600. However, seller congestion at $2,650 curtailed the uptrend.
Meanwhile, the largest altcoin trades slightly below $2,600 ahead of a potentially massive breakout from the ascending triangle. This technical pattern is regarded as bullish in technical analysis. It can function as a continuation and a bullish reversal pattern.
Two trend lines characterize the ascending triangle, linking the relatively equal peaks and the higher lows. As the lines meet, consolidation is experienced. Finally, the Ethereum price cracks the horizontal (x-axis) resistance.
ETH/USD 4-four Chart
Realize that triangles usually have exact breakout targets measured from the patterns’ highest to lowest points. Therefore, ETH could be heading toward a 40% upswing to price levels of around $4,000.
Ethereum’s uptrend has been validated by relatively weak on-chain resistance, as the IntoTheBlock’s IOMAP model highlights. This transaction model shines a light on the region running from $2,590 to $2,667. Here, nearly 277,500 addresses previously purchased 3.54 million ETH. With minor boosts, Ethereum’s price could jump above this zone for gains heading toward $3,000.
Ethereum IOMAP Model

On the downside, Ether sits on top of a massive support area running from $2,430 to $2,508. Here, around 458,000 addresses previously bundled up 10.5 million ETH. Note that cracking through this zone will not be easy for bears; hence the least resistance path is upward.
Ripple Price On The Periphery A Technical Explosion To $1.34
Ripple price is stuck in consolidation at the time of writing. Support at $0.8 is robust, preventing losses from extending to $0.65 (May’s support). On the upside, $0.9 hinders price action north.
Meanwhile, Ripple price dodders at $0.88 and is within the confines of a symmetrical triangle pattern. As the two trend lines forming the triangle converge, a consolidation period comes into the picture.
However, a breakout soon approaches either above or below the symmetrical triangle. A break above the upper trend line marks an uptrend while striking beneath the lower trendline is a bearish signal.
XRP/USD 4-hour Chart
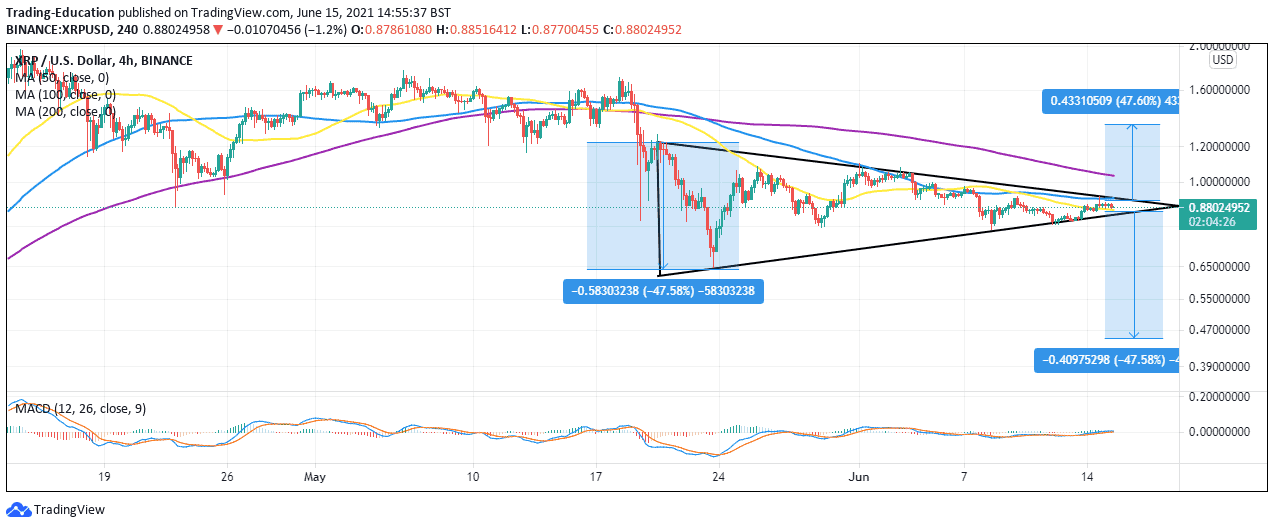
If Ripple price closes the day above the 100 SMA, a breakout to $1.34 will likely come into play. Besides, massive buy orders would be triggered if Ripple reclaims the ground above $1.
The Moving Average Convergence Divergence (MACD) indicator adds credence to the bullish outlook after moving into the positive region. Besides, the MACD line crossing above the signal paves for more buyers to join the market.
How Aave Price Could Quickly rise to $440
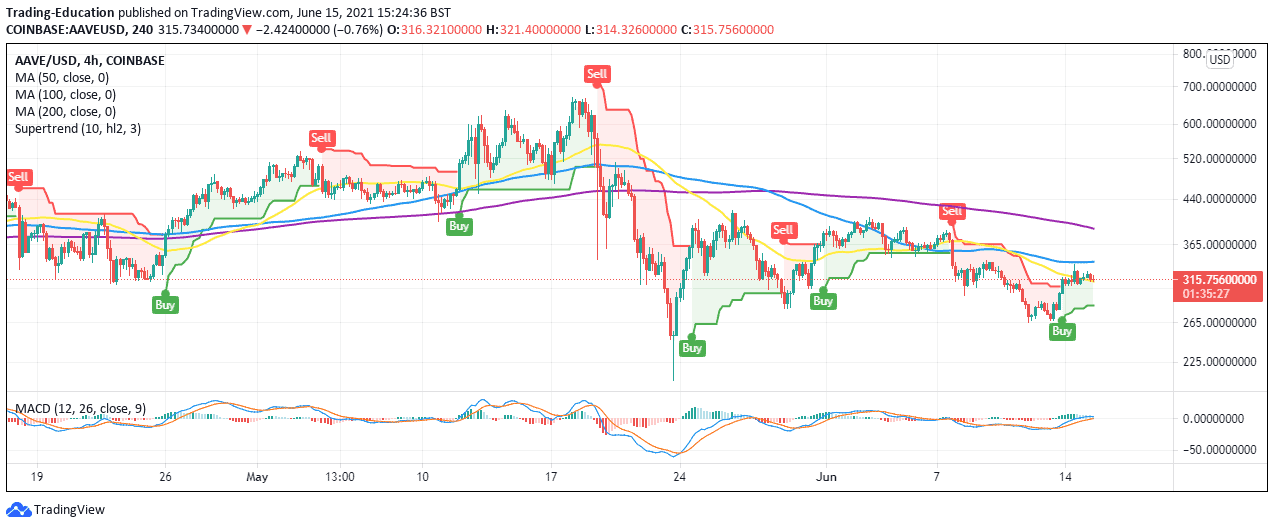
Aave price uptrend from June’s lowest support at $265 failed to overcome the seller congestion at the 100 SMA on the four-hour chart this week, leading to a correction toward $300. Hence, the decentralized finance (Defi) token teeters at $315 at the time of writing.
The rejection at the 100 SMA notwithstanding, the SuperTrend indicator flashed a buy signal on Monday. This is a chart overlay tool resembling a moving average only that it considers the asset’s volatility.
A buy signal implies that trades will be contemplating taking long positions, supporting the bullish price action in the near term. Besides, the MACD has a bullish Impulse, adding credibility to the impending upswing.
AAVE/USD Four-hour Chart
The IOMAP on-chain model reveals that Aave price has a smooth path to the seller congestion in the region between $433 and $471. Here, 6,400 addresses previously bought 2.48 million AAVE. If this hurdle comes down, we can expect Aave price to soar beyond $500.
Aave IOMAP Model

On the flip side, the Defi token sits on top of immense support areas, as highlighted by the IOMAP. The initial anchor zone lies between $221 and $270, whereby 1,900 addresses previously scooped up 3 million AAVE. It would be a daunting task for sellers to make their way through this region in the short term.
Binance Coin Price Needs This Key Support To Rally To $440
Binance Coin, the native coin of the crypto trading platform Binance exchange, is hunting for support at the 100 SMA on the four-hour chart. If this buyer congestion is lost, the last resort would be the 50 SMA in the same timeframe.
Note that the MACD has a massive bullish outlook based on the move above the zero line. Additionally, the MACD line (blue) recently crossed above the signal line, compelling more buyers to reenter the market. Sustaining the overall technical picture would bolster Binance Coin price above the critical resistance at the 200 SMA.
BNB/USD 4-hour Chart
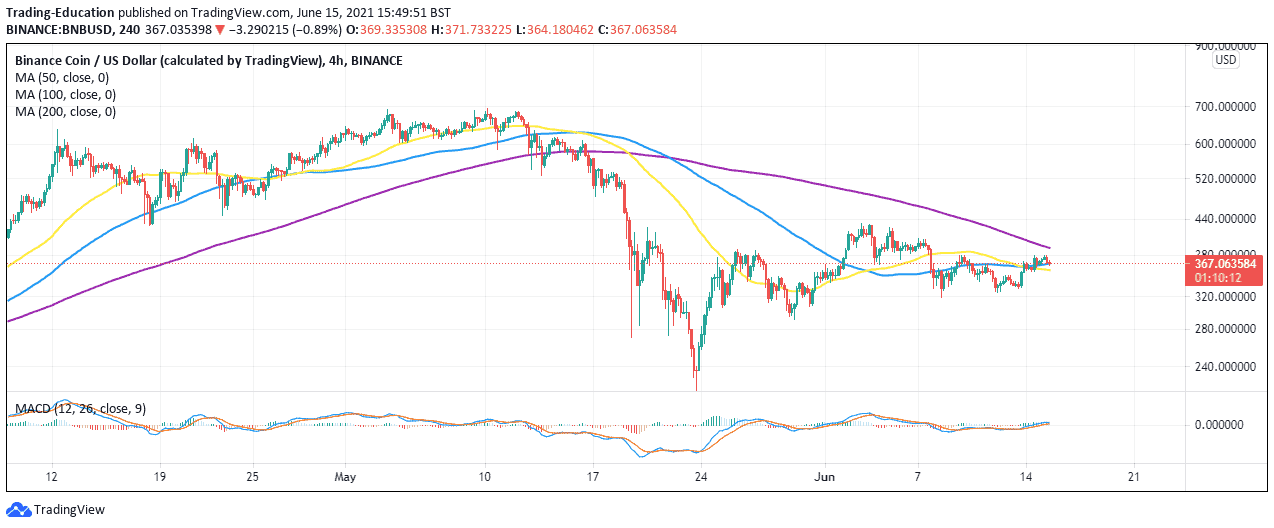
A four-hour close above the 200 SMA is needed to validate the upswing above $400. Finally, trading above this level is bound to trigger more buy orders as investors speculate an upswing past $440 and $500, respectively.
Looking to buy or trade Binance Coin (BNB) now? Invest at eToro!
Capital at risk


