Bitcoin (BTC) Price Prediction: BTC/USD Struggles to Break Above $58,000 Resistance, Lacks Buyers at Higher Price Levels

Bitcoin (BTC) Price Prediction – May 3, 2021
BTC/USD is in a brief uptrend and has partially broken above the $58,000 resistance. The bullish momentum could not be sustained above the resistance level because of intense selling pressure. Bitcoin now fluctuates between $56,000 and $58,000 price levels.
Resistance Levels: $65,000, $70,000, $75,000
Support Levels: $50,000, $45,000, $40,000
Today, the BTC price has returned to retest the $58,000 resistance level. The $58,000 support level has been the crucial price level that has facilitated the resumption of upside momentum. On the upside, Bitcoin bulls are retesting the recent high for a possible breakout. If buyers succeed in breaking the current resistance the market will rally to the $60,000 high. Also, if the $60,000 psychological price level is breached, Bitcoin will resume the second round of upside momentum. However, if BTC price rallies the $60,000 high and fails to sustain above the psychological price level, the market will not hesitate to fall to the previous price level. Bitcoin is trading at $57,956 at the time of writing.
Turkey Jails Six Suspects Over Missing CEO of Thodex Crypto Exchange
The missing Thodex CEO is reported to have own millions of dollars worth of crypto. Turkish authorities are investigating the local cryptocurrency exchange, Thodex, which has ceased operation abruptly. The Turkish court has already jailed six suspects including siblings of the missing CEO and senior company employees. According to reports 83 individuals suspected to be involved in the case have been detained. There are growing concerns that Thodex was a scam after the platform halted money withdrawals. Nevertheless, the missing Thodex CEO is reported to have gone with as much as $2 billion worth of crypto. From the latest reports, interior minister Soylu said that the company’s portfolio has a total of $108 million.
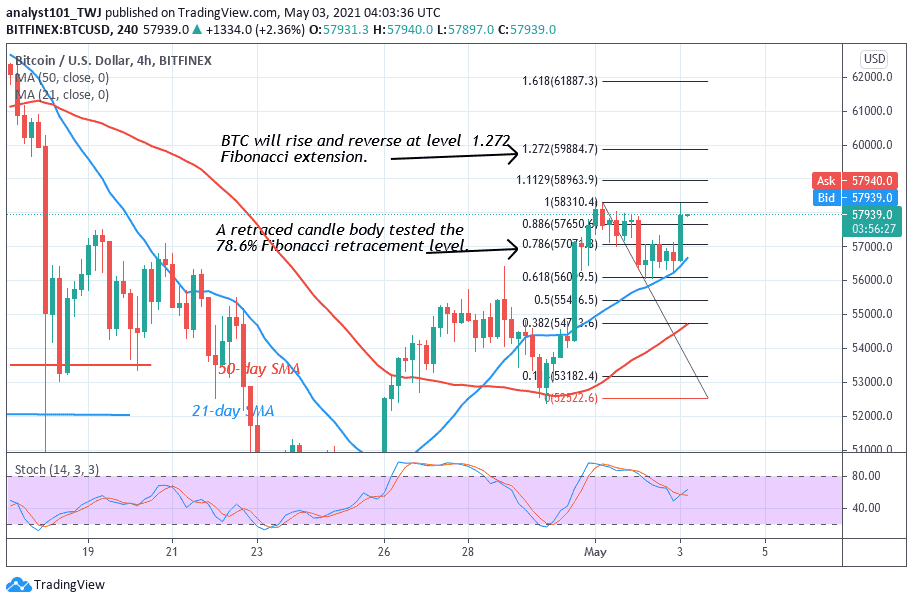
On the 4-hour chart, the BTC price is struggling to break above the $58,000 resistance. The Fibonacci tool has indicated a possible rise to the $60,000 high and subsequent reversal. On May 1 uptrend. a retraced candle body tested the 78.6% Fibonacci retracement level. This retracement indicates that the market will rise and reverse at level 1.272 Fibonacci extension or the high of $59,884.70.