Bitcoin Price Prediction: BTC/USD Drops Below $50,000 Support; Watch Out for the Next Move
Bitcoin (BTC) Price Prediction – April 24
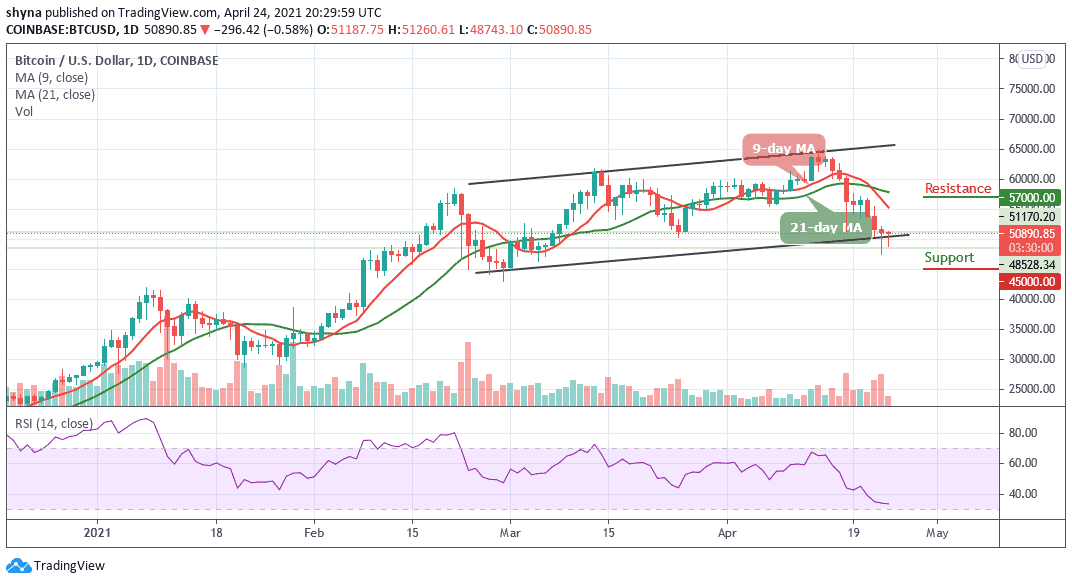
According to the daily chart, the Bitcoin price slides under $50,000 as buyers struggle to secure a formidable support level.
BTC/USD Long-term Trend: Bullish (Daily Chart)
Key levels:
Resistance Levels: $57,000, $59,000, $61,000
Support Levels: $45,000, $43,000, $41,000
BTC/USD may undergo an aggressive bull run in the coming sessions if the market price recovers above the resistance level of $52,000. However, the Bitcoin price typically pullbacks after crossing below the lower boundary of the channel. More so, the cryptocurrency breaks toward the south where traders can call a support base before retracing its move upward to where it is currently trading at $50,890.
What is the Next Direction for Bitcoin?
The past few days were somewhat similar, as BTC/USD even dipped to $47,500 support. Meanwhile, since BTC/USD plummeted in value last week by more than $10,000 in a few days, the king coin is struggling to recover as it taps the $51,000 level again. However, bulls are expected to start pushing the cryptocurrency towards the north. For this to come to focus, the 9-day MA must be able to cross above the 21-day MA.
However, if the market price moves above the moving averages, it may signal a jump towards $53,000, while breaking below the lower boundary of the channel may see Bitcoin drop to $46,000. Therefore, any bullish movement towards the north could locate the resistance levels at $57,000, $59,000, and $61,000 while the supports lie at $45,000, $43,000, and $41,000 as the technical indicator RSI (14) moves below 34-level.
BTC/USD Medium – Term Trend: Bearish (4H Chart)
The Bitcoin price is now trading around $50,966 after rebounding from $48,743. Looking at the 4-hour price chart, we can see that the bullish supply coming up slowly in the market, but bears are also trying to drag the price below the 9-day moving average. Meanwhile, the $48,000 support level and below may come into play if BTC breaks the 9-day MA.
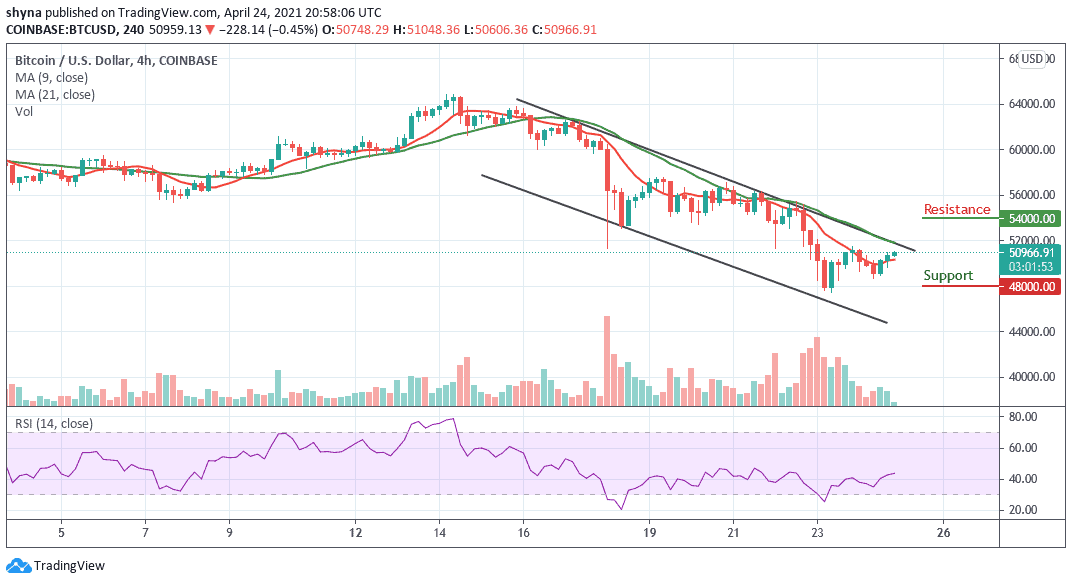
However, if buyers can strengthen and push the market price above the moving averages, we can expect a retest of $51,000 resistance level. Therefore, breaking the mentioned resistance could also allow the bulls to test the $54,000, and above. However, the technical indicator RSI (14) moves above 40-level to indicate an uptrend.