Bitcoin Price Prediction: BTC/USD Falls Below $52,000 in Sudden Sell-Off
Bitcoin (BTC) Price Prediction – April 23
BTC/USD begins another breakdown and the price could hit $45,000. The sell-off has resumed as Bitcoin price faces a fresh round of selling.
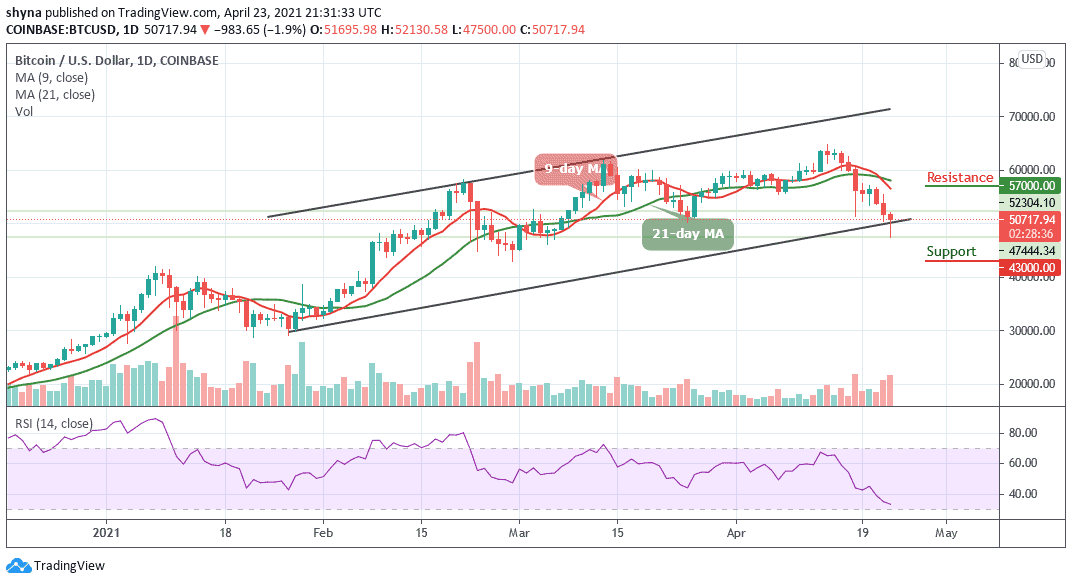
BTC/USD Long-term Trend: Bullish (Daily Chart)
Key levels:
Resistance Levels: $57,000, $59,000, $61,000
Support Levels: $43,000, $41,000, $39,000
BTC/USD resumes back into a selling mode, after an erratic recovery during the previous days. Early this morning, the coin topped at $52,130 and has been in retreat ever since. At the time of writing, BTC/USD is trading at $50,717, down 1.9% since the price crosses below the lower boundary of the channel.
Where is BTC Price Going Next?
BTC/USD price is struggling to hold a couple of important supports near $50,000. The price is likely to continue lower below the $48,000 and $46,000 support levels. If there is a downside break below the $45,000 support level, the price could visit the $44,000 support level. The bears are gaining momentum and if the price clears the $44,000 support, there is a risk of a sharp decline to $43,000, $41,000, and $39,000 support levels.
In addition, the market is deciding below the moving averages, where the buyers are anticipating a rebound. Meanwhile, the $51,000 and $52,000 levels may further surface as potential resistances should the $50,500 level holds. However, a strong bullish spike might take the price to $57,000, $59,000, and $61,000 resistance levels. But presently, the RSI (14) is below the 35-level.
BTC/USD Medium – Term Trend: Bearish (4H Chart)
Following the 4-hour chart, Bitcoin bears are now pushing the price below its previous support level that existed around $49,000. Although, the Bitcoin price has not yet slipped below $49,500 and it’s still in the loop of making a bounce back. Its price hovers around $50,382 and may take time to persistently trade above $51,000.
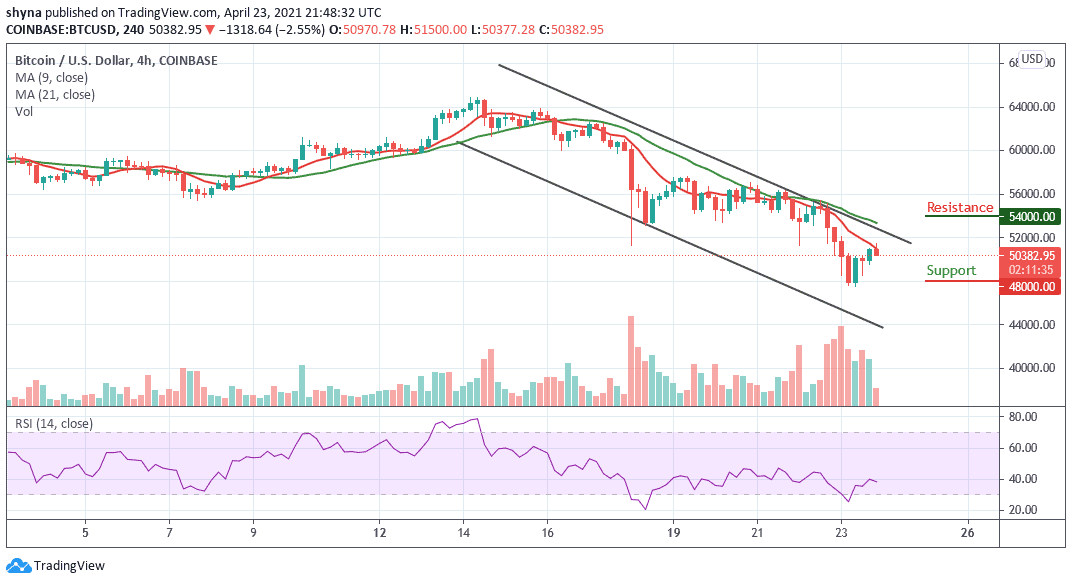
Nevertheless, BTC/USD is currently moving below the 9-day and 21-day moving averages and any upward movement may push the price near the $54,000, $56,000, and $58,000 resistance levels while the immediate support lies at $48,000, $46,000, and $44,000. The RSI (14) moves around 38-level, which may likely give more bearish signals before a reversal could play out.