Bitcoin Price Prediction: BTC/USD Jumps Another 3% Gains to Reclaim $59,000 Level
Bitcoin (BTC) Price Prediction – May 8
After a sudden and bullish price spike, BTC/USD moves toward the long-awaited $60,000 resistance.
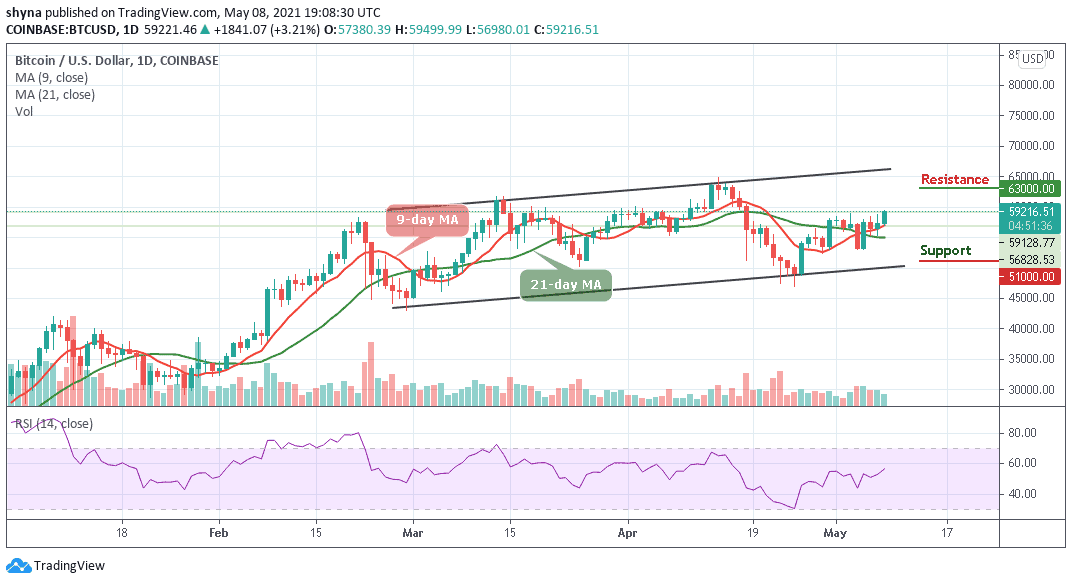
BTC/USD Long-term Trend: Ranging (Daily Chart)
Key levels:
Resistance Levels: $63,000, $65,000, $67,000
Support Levels: $51,000, $49,000, $47,000
BTC/USD has once again given more than 3% pullback surging past $59,000 resistance and looking forward to breaking past its crucial resistance of $59,500. At the time of writing, BTC is trading 3.21% up at $59,216 with a market cap of $1.104 trillion. More so, while Bitcoin has been trading flat over the last month (April 2021) and consolidating around $55,000, the first digital asset has been making the most of this opportunity.
What is the Next Direction for Bitcoin?
The daily chart reveals that BTC/USD has traded above the crucial level of $59,000. Meanwhile, on the upside, as the coin moves above both the 9-day and 21-day moving averages, little is in place to prevent correction targeting the key resistance of $60,000 as the technical indicator Relative Strength Index (14) moves toward the 60-level to confirm the uptrend.
However, BTC/USD is currently supported by the former resistance level of $56,000 but if the price falls below this level and move to cross the 9-day and 21-day moving averages, the Bitcoin price could find support at $51,000, $49,000, and $47,000. In the opposite manner, the continuation of the bullish movement towards the upper boundary of the channel could pave the way for gains above $60,000 before reaching the resistance levels of $63,000, $65,000, and $67,000.
BTC/USD Medium – Term Trend: Bullish (4H Chart)
Looking at the 4-hour chart, BTC/USD is currently trading around $59,183 after a reversal from the $58,837 level. However, traders can see that the bullish supply is becoming heavy in the market while the bears are trying to bring the price down.
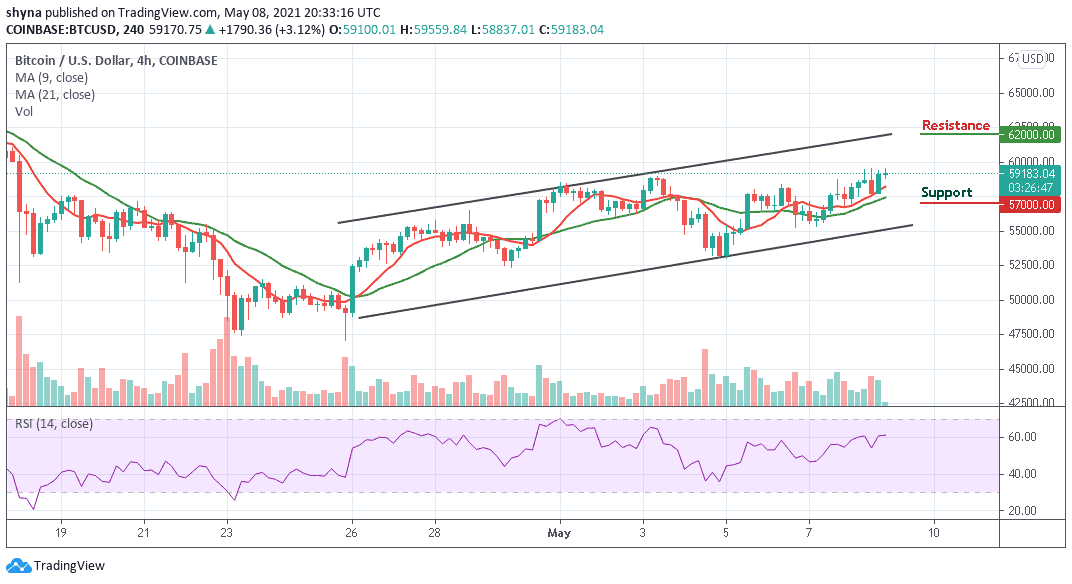
In addition, if the buyers could further strengthen the market, the Bitcoin price may reach the resistance level of $60,000. Moreover, the technical indicator RSI (14) remains above 60-level; therefore, breaking to the upside could allow the bulls to hit the potential resistance at $62,000 and above. On the contrary, if the market price turns down; the bears may take the opportunity to bring the price to the support level of $57,000 and below.