Bitcoin Price Prediction: BTC/USD Trades Above $53,500; Is the Price Back Bullish?
Bitcoin (BTC) Price Prediction – April 26
The Bitcoin price hits the major resistance level at $54,000 instead of just battling with supports.
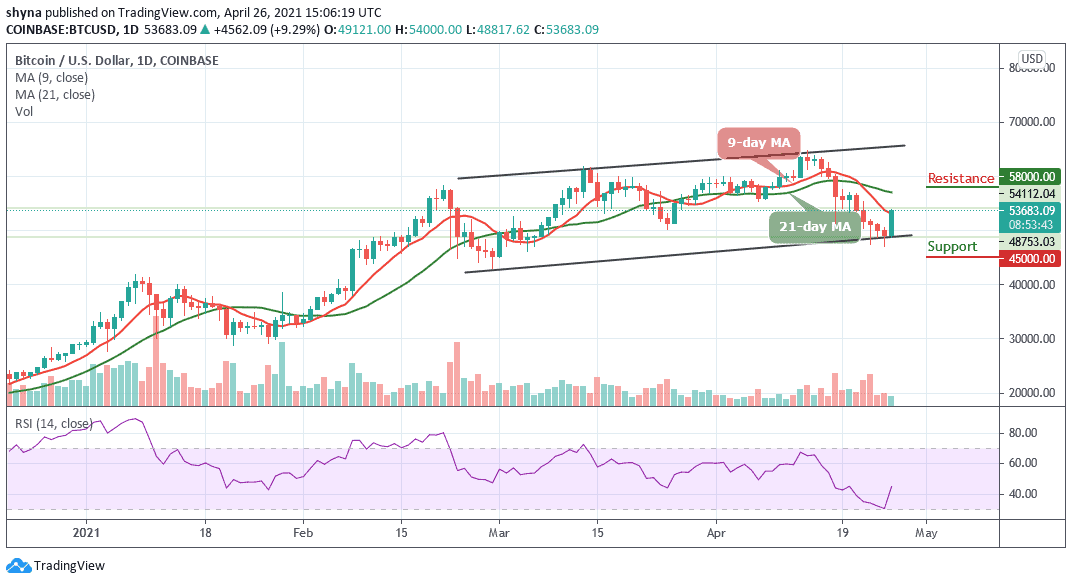
BTC/USD Long-term Trend: Ranging (Daily Chart)
Key levels:
Resistance Levels: $58,000, $60,000, $62,000
Support Levels: $45,000, $43,000, $41,000
BTC/USD now hits the price area around $53,600 after almost a weeklong of despairing trade. However, since the coin is currently correcting upwards, we believe that BTC/USD is likely to cross resistances instead of just battling inactive supports. Today, BTC/USD is seen trading at $53,683 after closing at $49,121 yesterday.
What is the Next Direction for Bitcoin?
BTC/USD is seen pulling back to where it is trading currently and may continue to head upward if the bulls maintain the price movement. Looking at the daily chart, BTC/USD is currently trading above few crucial levels which may function as the support zones in the event a reversal occurs.
Meanwhile, on the upside, as the coin moves towards the 9-day and 21-day moving averages, little is in place to prevent correction targeting the key resistance of $55,000 as the technical indicator RSI (14) moves above the 42-level.
Moreover, bulls are banking on the support at $45,000, $43,000, and $41,000 to ensure that in spite of a reversal, the Bitcoin price stays above the $53,900 level. Similarly, the nearest resistance levels may be located at $58,000, $60,000, and $62,000 respectively.
BTC/USD Medium – Term Trend: Bearish (4H Chart)
Looking at the 4-hour chart, bears have been dominating the market for the past few weeks, but bulls are now coming back into the market trading above the 9-day and 21-day moving averages and trying to defend the $52,000 support. If not, the $50,000 and below may come into play if BTC breaks below the mentioned supports.
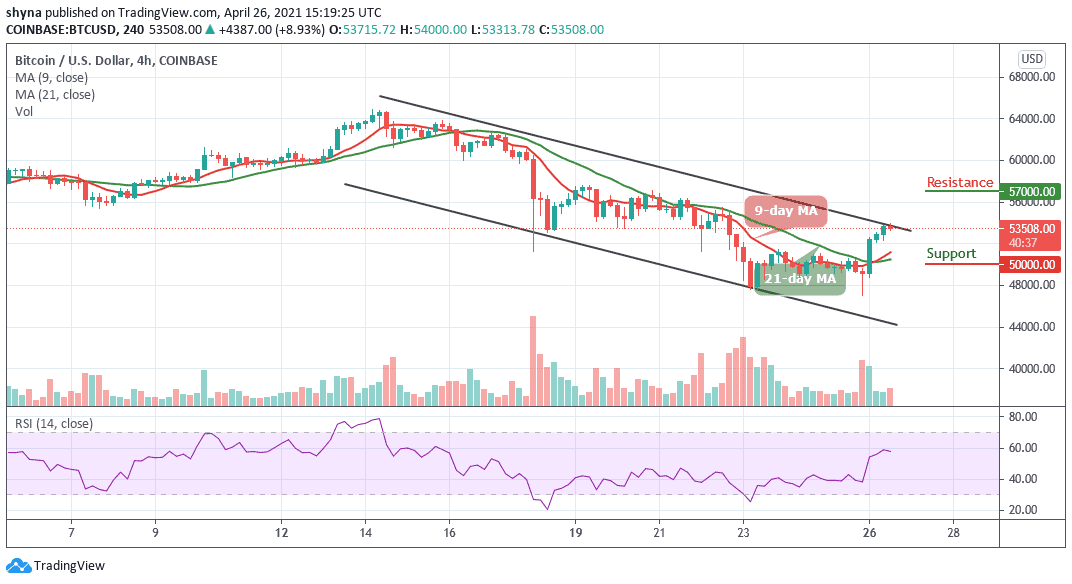
However, in as much as the buyers continue to reinforce and power the market more, traders can expect a retest at the $55,000 resistance level, and breaking this level may further push the price towards the resistance level of $57,000 and above. The RSI (14) is trading below the 60-level.