Bitcoin Price Prediction: BTC/USD Trades below $58,000 Resistance
Bitcoin Price Prediction – May 12
The Bitcoin price touches the daily high of $58,041 as it is down to a low of $54,721. No quick recovery seems possible for Bitcoin.
BTC/USD Long-term Trend: Ranging (Daily Chart)
Key levels:
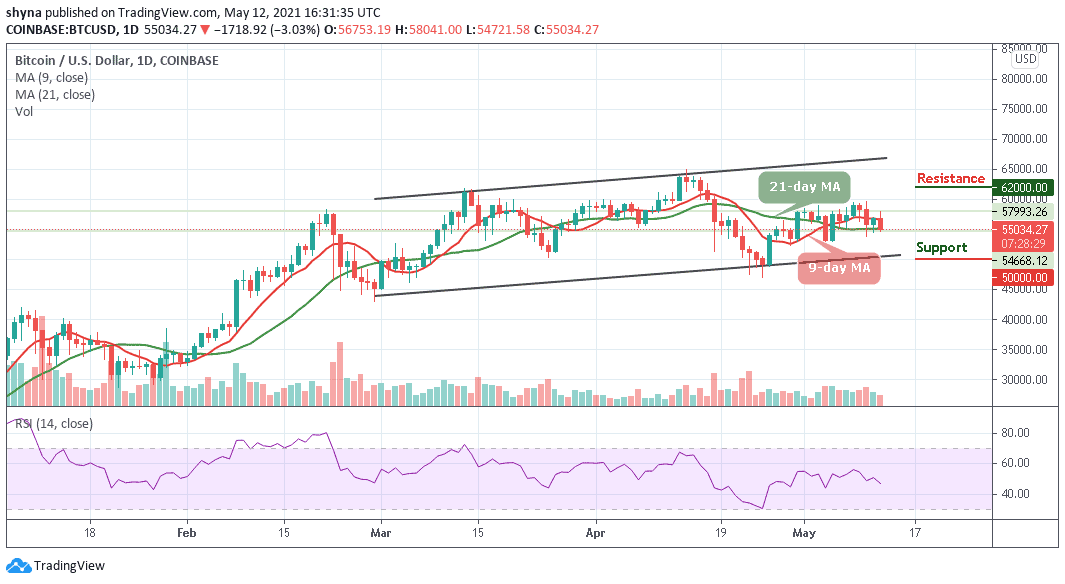
Resistance Levels: $62,000, $64,000, $66,000
Support Levels: $50,000, $48,000, $45,000
After forming a short-term top, BTC/USD price dived below $58,000 and $56,000 as the Bitcoin price is currently consolidating around $55,034, with a few bearish signals. However, the recent correction to the upward failed near the $58,041 level. It seems like Bitcoin bulls are struggling to gain momentum above the $55,000 level.
Bitcoin Price Prediction: Would Bitcoin Price Go Up or Down?
The Bitcoin price is currently trading within the 9-day and 21-day moving averages. On the downside, the $55,000 and $54,000 levels are initial supports. Therefore, if the bulls fail to defend the recent low of $54,721, there is a risk of a sharp decline. However, if the bears drag the price below the 9-day and 21-day moving averages, then, the Bitcoin (BTC) could drop to the critical supports of $50,000, $48,000, and $46,000 respectively.
Nevertheless, if there is a clear break above the 9-day moving average, the Bitcoin price could test the $59,000 resistance level. If the bulls manage to gain strength above $60,000, there are chances of a decent recovery towards the $61,000 resistance area. More so, the key breakout zone is near the $62,000, $64,000 and $66,000 resistance levels. Meanwhile, the Relative Strength Index (14) for BTC/USD is moving below the 50-level, suggesting more bearish signals.
BTC/USD Medium – Term Trend: Ranging (4H Chart)
During the European session, the Bitcoin price first went up but has dropped tremendously below the 9-day and 21-day moving averages, bringing its price from $58,041 to reach the low of $54,429. More so, if the price continues to drop further and move below the channel, it could reach the nearest support levels of $53,000, $52,000, and $50,000.
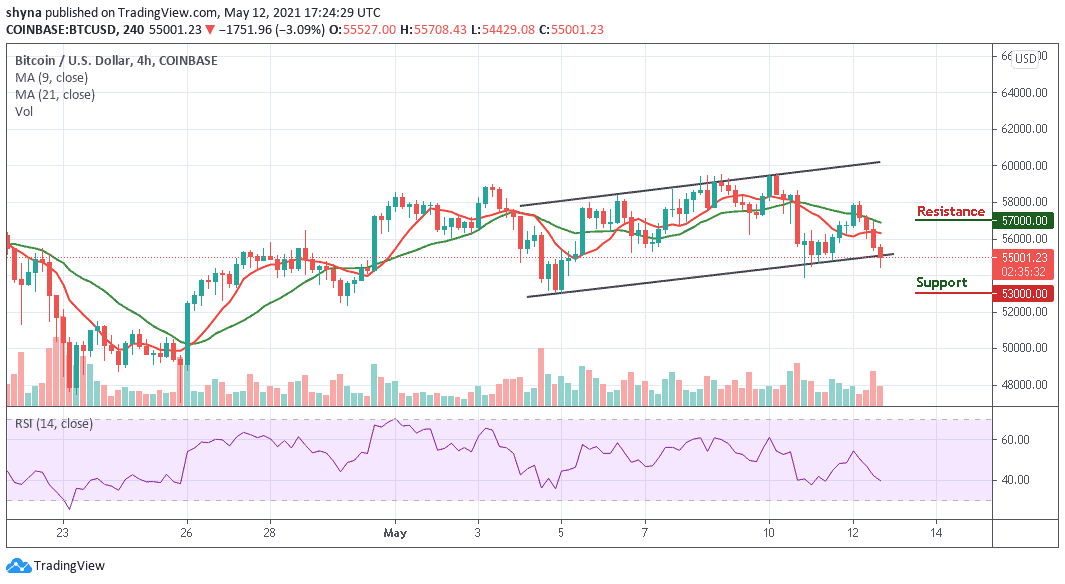
Moreover, if the bulls push the coin above the 9-day and 21-day moving averages, the Bitcoin price may likely hit the potential resistance levels of $57,000, $59,000, and $61,000. At the moment, the hourly market is bearish as the Relative Strength Index (14) indicator prepares to move below the 40-level.