Bitcoin Price Prediction: BTC/USD Tumbles as the Price Plummets Below $59,300
Bitcoin (BTC) Price Prediction – May 9
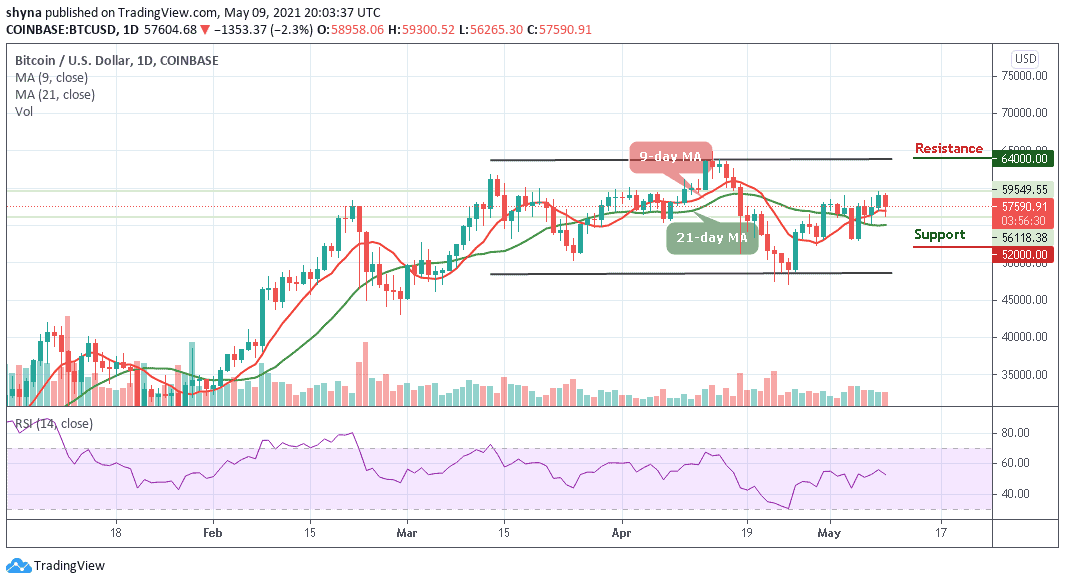
According to the daily chart, the Bitcoin price extends the bearish movement to the areas marginally below $58,000 after numerous trials to sustain gains above $60,000.
BTC/USD Long-term Trend: Ranging (Daily Chart)
Key levels:
Resistance Levels: $64,000, $66,000, $68,000
Support Levels: $52,000, $50,000, $48,000
BTC/USD falls toward $10,300 once again as the largest cryptocurrency embarked on a support smashing exercise after failing to hold above $59,300 following a significant breakout in the last few days. Therefore, the bearish control is seen across the market with other major digital assets posting similar losses as they trade below the 9-day moving average.
Where is BTC Price Going Next?
BTC/USD is trading at $57,590.91 with an intraday loss of 2.3%. The prevailing trend is bearish with expanding volatility. The first digital asset is currently consolidating in a bearish flag pattern. Meanwhile, a break down from this pattern is supposed to continue in the direction of the previous trend. In this case, BTC/USD is expected to drop and stay below $9-day MA and could move towards the critical support levels at $52,000, $54,000, and $56,000.
However, should Bitcoin price remains above the moving averages; the price could rise to $60,000 vital resistance. A further bullish drive could push the price to $64,000, $66,000, and $68,000 resistance levels. The technical indicator Relative Strength Index (14) is revealing a sign of trend reversal, which shows a possible more bearish momentum may continue to play out.
BTC/USD Medium – Term Trend: Ranging (4H Chart)
At the opening of the market today, the Bitcoin price first went up but dropped slightly within 24 hours, bringing its price from $59,300 to reach around $56,265. Should the price continue to drop further and move below the 9-day and 21-day moving averages, it could reach the nearest support level at $56,000 and below.
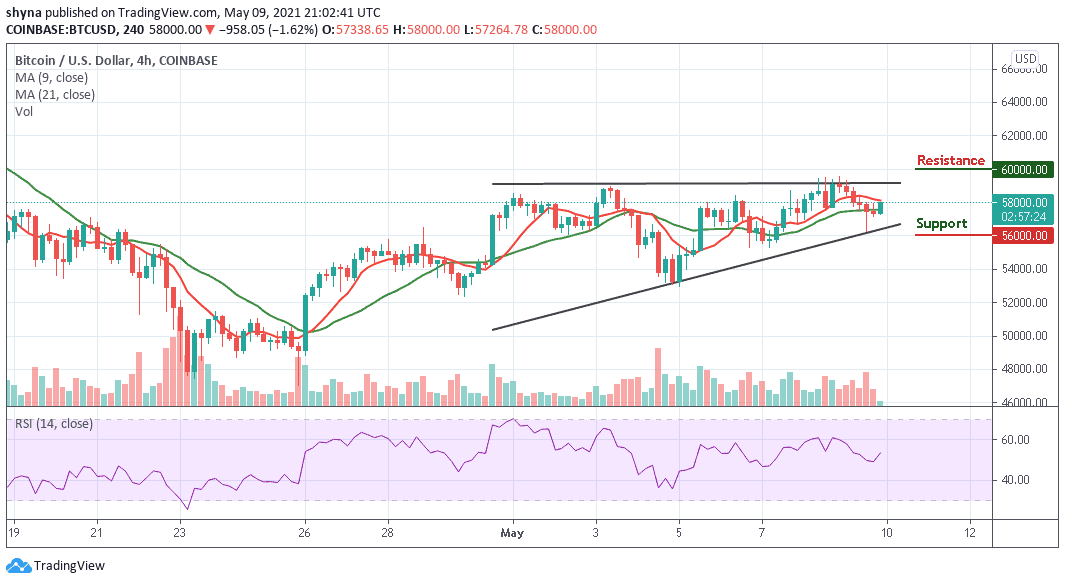
Moreover, if the bulls push the coin above the upper boundary of the channel, the Bitcoin price could reach the potential resistance level of $60,000 and above. Presently, the market may continue to move sideways or experience an uptrend as the Relative Strength Index (14) indicator moves to cross above the 50-level.