Bitcoin Price Prediction: BTC/USD Accelerates Towards $60,000 As Bulls Blow Hot
Bitcoin (BTC) Price Prediction – May 1
With Bitcoin shooting close to $58,000 once again, it has done little to flip the market sentiment at this stage
BTC/USD Long-term Trend: Bullish (Daily Chart)
Key levels:
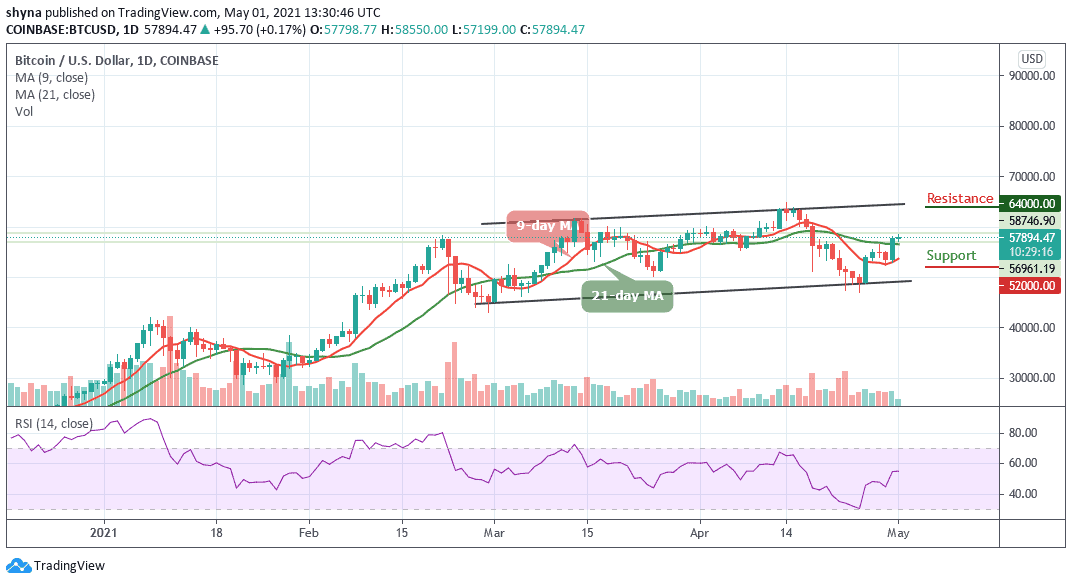
Resistance Levels: $64,000, $66,000, $68,000
Support Levels: $52,000, $50,000, $48,000
Looking at the daily chart, BTC/USD is correcting gains from $58,500 and it is likely to start a new increase as long as there is no close below $57,000. This morning, the Bitcoin price saw a steady increase above the $57,000 resistance level as the coin hovers at $57,894. Presently, BTC/USD is settling above the 9-day and 21-day moving averages.
Where is BTC Price Going Next?
BTC/USD is seen retracing and trading above the within moving averages and the market price stays under the daily high of $58,550 resistance as a sign of bullish momentum. Further increase in the bullish momentum may have to increase the price above this level; another resistance may come at $60,000 before reaching the potential resistance of $64,000, $66,000, and $68,000 levels.
However, if the resistance level of $57,500 failed to hold, it may reverse and face the support level at $55,000, further increase in the bears’ pressure may push down the price towards the 9-day moving average and possibly hit the critical supports at $52,000, $50,000, and $48,000. Meanwhile, the technical indicator RSI (14) signal line is moving above 50-level, crossing below it may ignite sell signals into the market.
BTC/USD Medium – Term Trend: Bullish (4H Chart)
According to the 4-hour chart, the Bitcoin price is seen trading above the 9-day and 21-day moving averages at $57,427. However, at the time of writing, BTC/USD is trading at a $57,427 resistance level but any bearish cross below the 9-day moving average may drag the coin to hit the supports at $54,000 and below.

Furthermore, if Bitcoin finds a decent resistance level around $60,000 level, it may start another bullish movement above the upper boundary of the channel which may likely reach the resistance level of $62,000 and above. In other words, the technical indicator RSI (14) is seen moving to cross below the 60-level, suggesting additional bearish signals into the market.