Bitcoin Price Prediction: BTC/USD Faces Fresh Bull-Run; Price Back Above $56,000 Resistance
Bitcoin (BTC) Price Prediction – April 30
Bitcoin has been ripping higher over the past few hours, raising the probability of closing this month in the green.
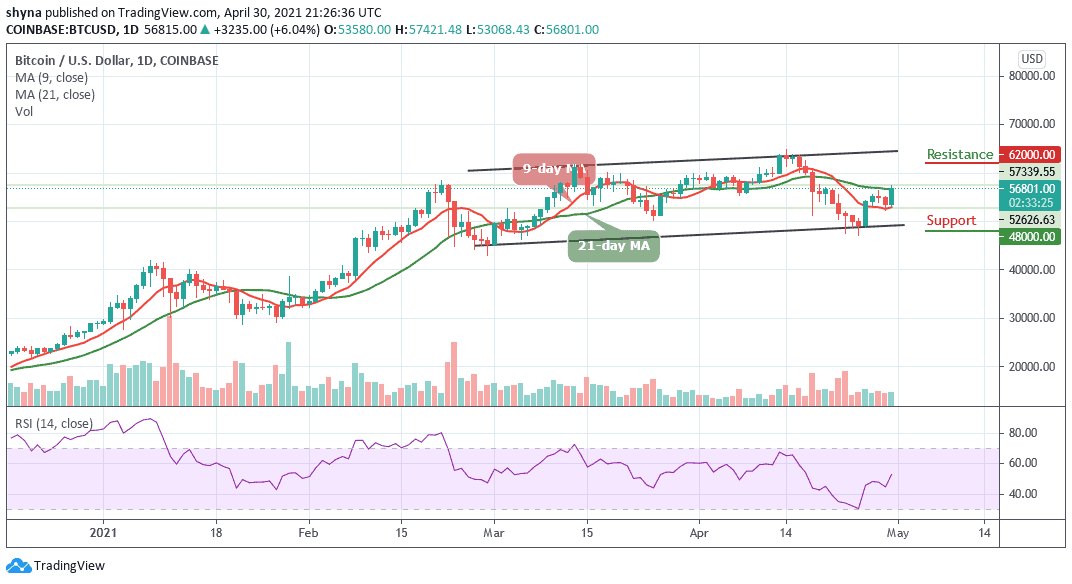
BTC/USD Long-term Trend: Ranging (Daily Chart)
Key levels:
Resistance Levels: $62,000, $64,000, $66,000
Support Levels: $48,000, $46,000, $44,000
After seeing its market bleed for weeks, BTC/USD has managed to stage a sudden comeback on the last day of April. The Bitcoin price is back above $56,000 once again, after a tug-of-war between bulls and bears have led to a bit of a stalemate just as the April monthly comes to a close.
What is the Next Direction for Bitcoin?
BTC/USD touches the daily high of $57,421 today, if the king coin breaks below the $56,000 level; it could test the next support lines at $55,000. Alternatively, Bitcoin has to reclaim the first resistance at $58,000 to head upwards. If successful, the primary cryptocurrency could aim high by reaching the resistance levels at $62,000, followed by $64,000, and $66,000 respectively. More so, BTC/USD is slowly moving higher towards the $57,000 resistance level.
On the other hand, if there is no clear break above $57,000, there are chances of a fresh decline. However, as the 9-day MA remains below the 21-day MA, the coin may stay within the negative side and initial support is near the $55,000 level. The main support may be forming below the moving averages, which the price could dive towards the supports of $48,000, $46,000, and $44,000 as the technical indicator RSI (14) moves above 50-level.
BTC/USD Medium – Term Trend: Ranging (4H Chart)
Looking at the 4-hour chart, BTC/USD is trading above the 9-day and 21-day moving averages. However, intraday trading is still looking bullish but a cross below the moving averages could hit the support level at $54,000 and below.
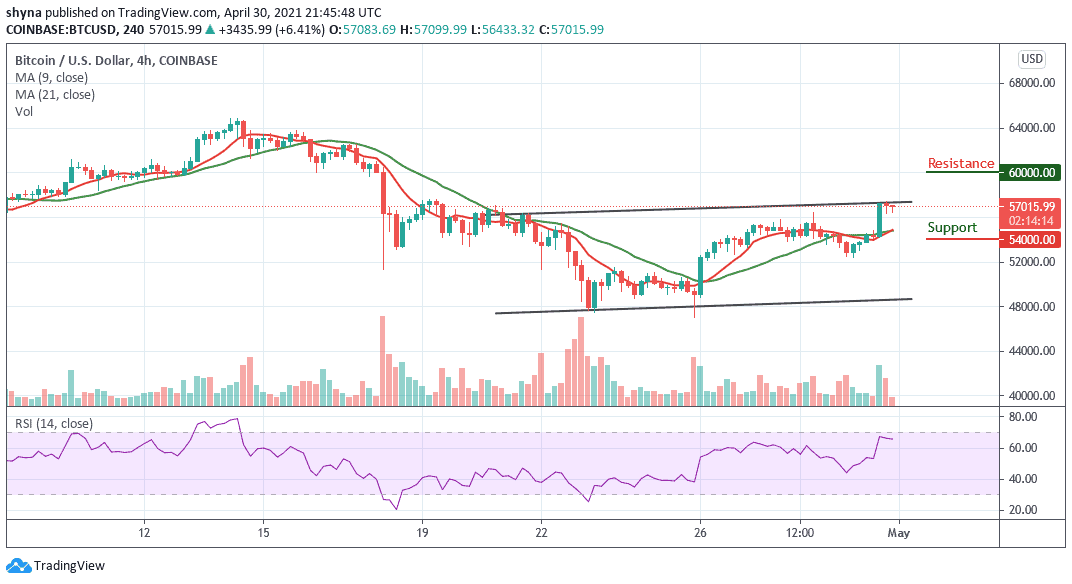
However, in as much as buyers keep moving the market upward, traders can expect a retest at the $57,500 resistance level, and breaking this level may further push the price towards the resistance level of $60,000 and above. Similarly, the RSI (14) moves above 60-level to confirm the bullish movement.