Bitcoin Price Prediction: BTC/USD Nosedives Toward $45,500
Bitcoin Price Prediction – May 15
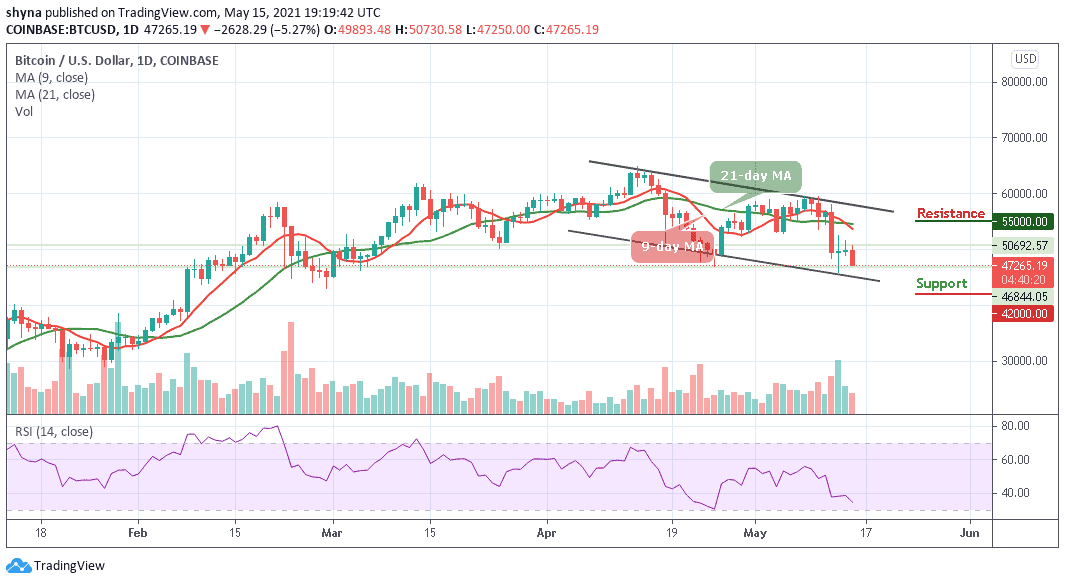
According to the daily chart, the Bitcoin price loses traction after hitting $50,730; losses likely to continue in the near term.
BTC/USD Long-term Trend: Bearish (Daily Chart)
Key levels:
Resistance Levels: $55,000, $57,000, $59,000
Support Levels: $42,000, $40,000, $38,000
Looking at the daily chart, it can be easily seen that the market is back in the red zone as BTC/USD is posting losses of 5.27% on the day after touching the $50,730. It has an intraday high close to $51,000; although the world’s largest crypto faces a serious downtrend as it is currently trading at $47,265.19.
Bitcoin Price Prediction: BTC/USD May Return to Red Zone
Bitcoin price just plunged below $48,000 one more time, marking $47,250 as the current daily low at the moment. Does this mean that Bitcoin (BTC) is finally leaving the significant $48,000 level and searching for a new low? Nevertheless, looking at the declining daily volume candle, together with the steady movement below the 8-day and 21-day moving averages; it can be assumed that a serious bearish movement may be coming up soon into the market.
Moreover, at the time of writing, BTC/USD is struggling to maintain the $50,000 level and if the Bitcoin price follows the downward trend as the Relative Strength Index (14) moves into the oversold region, the next supports may likely come at $42,000, $40,000, and $38,000. From the upside, by maintaining the current level of $47,265 and any bullish movement could go above the 9-day and 21-day moving averages and send the price to the resistance levels of $55,000, $57,000, and $59,000 which could be well above the channel.
BTC/USD Medium-Term Trend: Bearish (4H Chart)
On the 4-Hour chart, BTC price hovers below the 9-day and 21-day moving averages around $48,446 which may take time to persistently trade above $50,000. In addition, if the bulls gather enough strength and regroup, the upward movement may be able to near the resistance level of $52,000 and above.
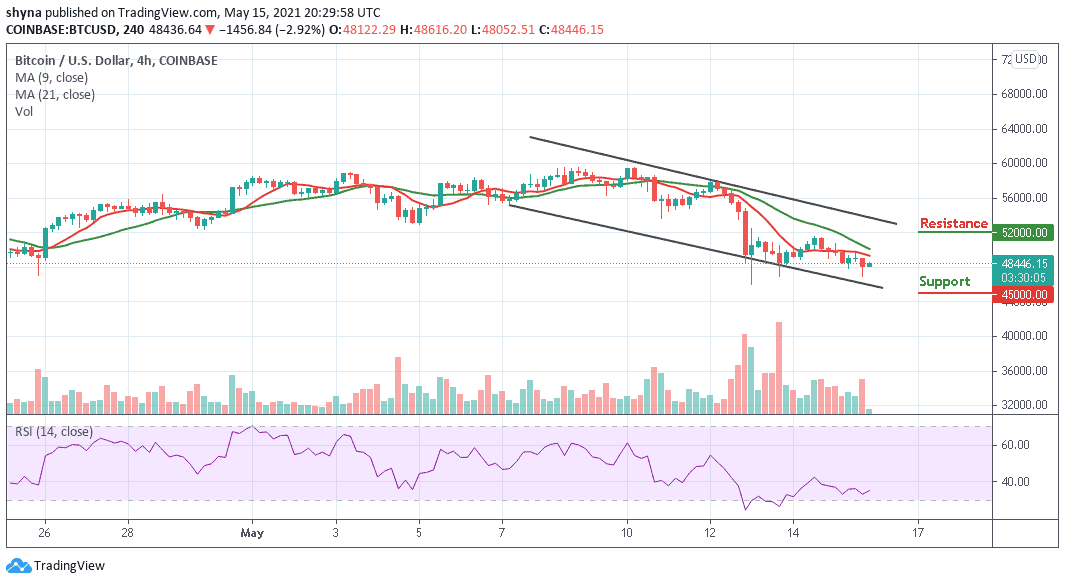
However, on the downside, immediate support is around the $47,500 level while the main support is at the $47,000 level. The price may likely fall below $46,000 if the bears step back into the market, a further movement could reach the critical support at $45,000 and below. Technically, BTC/USD is still moving in sideways while the Relative Strength Index (14) moves around 35-level, indicating an indecisive market movement.