Bitcoin Price Prediction: BTC/USD May See Further Downside to $45,000
Bitcoin Price Prediction – May 15
The Bitcoin price faces some immense selling pressure in the past few days, with the resistance finds within the $50,000 level.
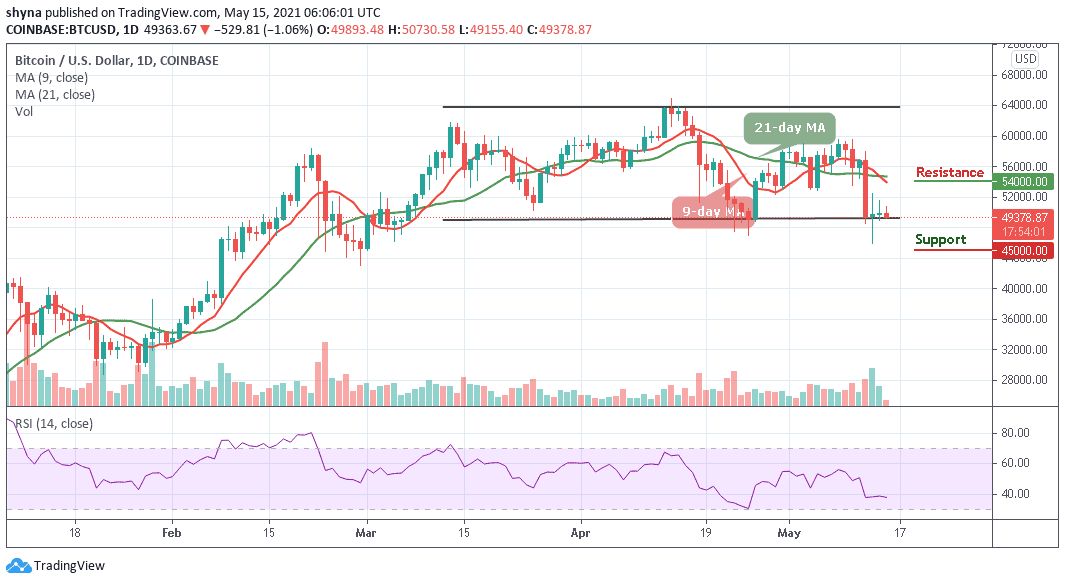
BTC/USD Long-term Trend: Ranging (Daily Chart)
Key levels:
Resistance Levels: $54,000, $56,000, $58,000
Support Levels: $45,000, $43,000, $41,000
BTC/USD range-bounds with the selling pressure seen around $49,000 level which is stopping it from seeing any major gains. Meanwhile, we are not surprised with the selling pressure as bears are trying to defend against a break above the all-time highs. However, until bulls break above this level, the Bitcoin price may continue to face a prolonged sideways movement.
Bitcoin Price Prediction: Any Hope for Bitcoin price?
At the time of writing, BTC/USD is trading down just under 1.06% at its current price of $49,378. The latest price reduction has made the Bitcoin price see a sharp cut below today’s opening price at $49,893 moving towards the south. In the time following this rally, BTC/USD has been making an effort to erase the gains accrued so far, with the crypto plummeting to lows of $49,155 before climbing slightly to its current price of $49,378.
Nevertheless, the Bitcoin price corrections of today have traced a falling flag that has been breached very recently. Meanwhile, looking at the daily chart, $45,000, $43,000, and $41,000 could serve as the major support levels, making room for BTC/USD to fall even further. The Relative Strength Index (14) for the coin moves in the same direction below 40-level.
On the other hand, if the technical indicator breaks above the 40-level, the Bitcoin price may cross above the 9-day and 21-day moving averages which could hit the resistance levels of $54,000, $56,000, and $58,000.
BTC/USD Medium – Term Trend: Bearish (4H Chart)
The 4-hour chart reveals that the $50,000 resistance level is been too heavy for bulls to overcome as the price is now struggling in a consolidation mode, which keeps the Bitcoin price below the 9-day and 21-day moving averages. However, any bullish movement to the upside may locate the potential resistance level at $54,000 and above.
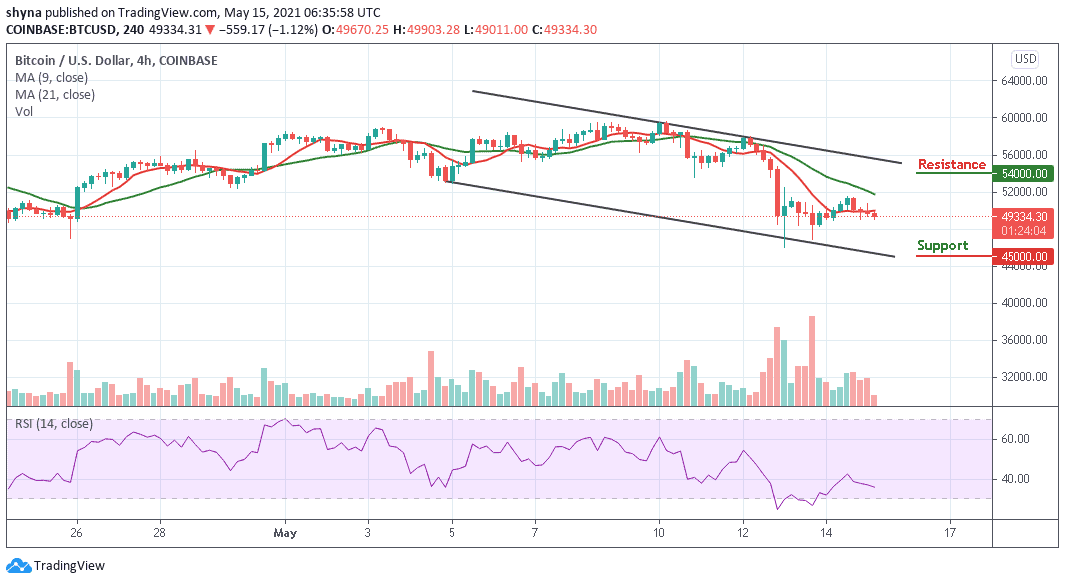
Nevertheless, the coin is still roaming around $49,334 as bears are pushing the Bitcoin price to the downside. Meanwhile, the $45,000 and below may come into play as the technical indicator Relative Strength Index (14) moves below 40-level.