Bitcoin Price Prediction: BTC/USD Shows Weakness at $47,000
Bitcoin Price Prediction – May 14
The Bitcoin price shows weakness at $47,000, but this crucial technical formation could elevate it above $55,000 resistance.
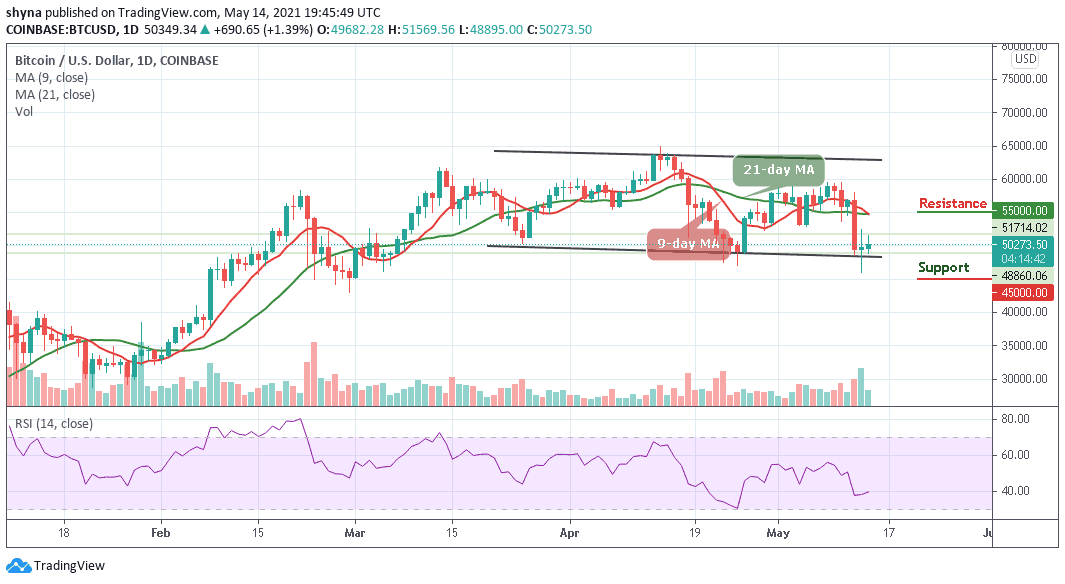
BTC/USD Long-term Trend: Ranging (Daily Chart)
Key levels:
Resistance Levels: $55,000, $57,000, $59,000
Support Levels: $45,000, $43,000, $41,000
In the last couple of days, BTC/USD stalled under $50,000. On the downside, immense support between $46,000 and $47,000 has ensured the bearish leg does not stretch further as the Bitcoin price has been pivotal at $50,000 causing it not to be able to make progress above this critical level. Meanwhile, Bitcoin (BTC) has been working on a recovery mission with a support level of $48,000.
Bitcoin Price Prediction: Where Would Bitcoin Price Go Next?
The Bitcoin price is moving above the crucial level of $50,250 which may now function as the support zone in the event a reversal occurs. Meanwhile, on the upside, as the coin moves toward the north, little is in place to prevent correction targeting the key resistance of $51,000 as the technical indicator Relative Strength Index (14) moves to cross above the 40-level.
However, as the daily chart reveals, BTC/USD is banking on the support at $48,000 and $46,000 to ensure that in spite of a reversal, the Bitcoin price stays above the $50,000 level. Moreover, if the coin moves to trade above the 9-day and 21-day moving averages, it may likely hit the resistance levels at $55,000, $57,000, and $59,000 while crossing below the lower boundary of the channel could locate the supports at $45,000, $43,000, and $41,000 respectively.
BTC/USD Medium – Term Trend: Bearish (4H Chart)
The 4-hour chart shows that the price will soon find its way upward as the Relative Strength Index (14) is about crossing above the 40-level. Although, the bears have dominated the market for some time now; it is high time for the bulls to defend the $47,000 support and push the price towards the north.
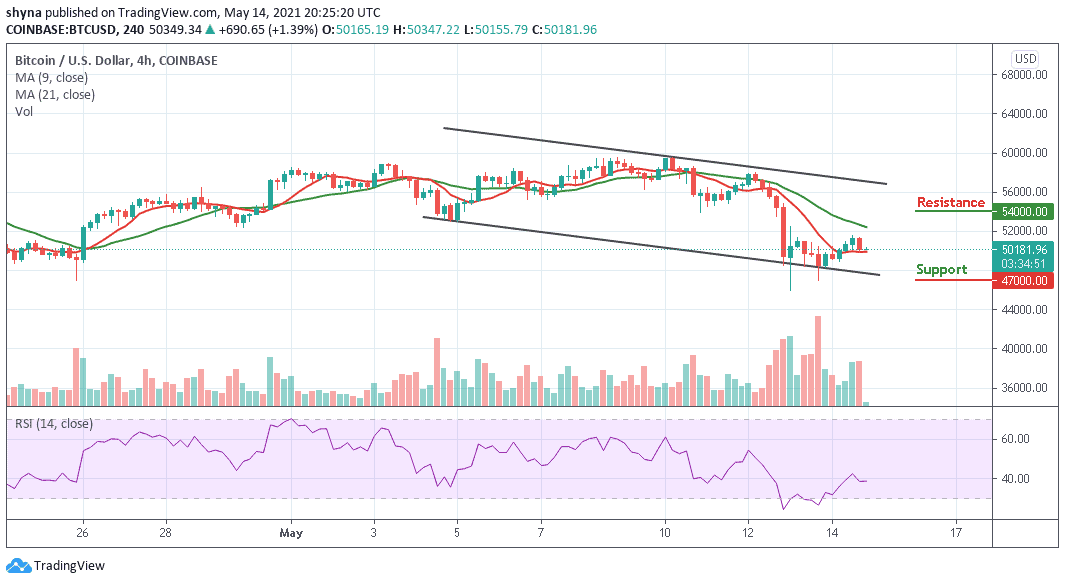
Meanwhile, the support level of $47,000 and below may come into play if the price breaks below the 9-day moving average within the descending channel. But in as much as the red-line of 9-day MA remains below the green-line 21-day MA; the market may continue to follow the downward trend but if the technical indicator crosses above the 40-level, it could touch the resistance level of $54,000 and above.