Bitcoin Price Prediction: BTC/USD Price Hunts for a Clear Pathway to $55,000 Resistance
Bitcoin (BTC) Price Prediction – April 29
Bitcoin is fighting to hold above the $54,000 but overhead pressure continues to make this task a difficult one for the bulls.
BTC/USD Long-term Trend: Ranging (Daily Chart)
Key levels:
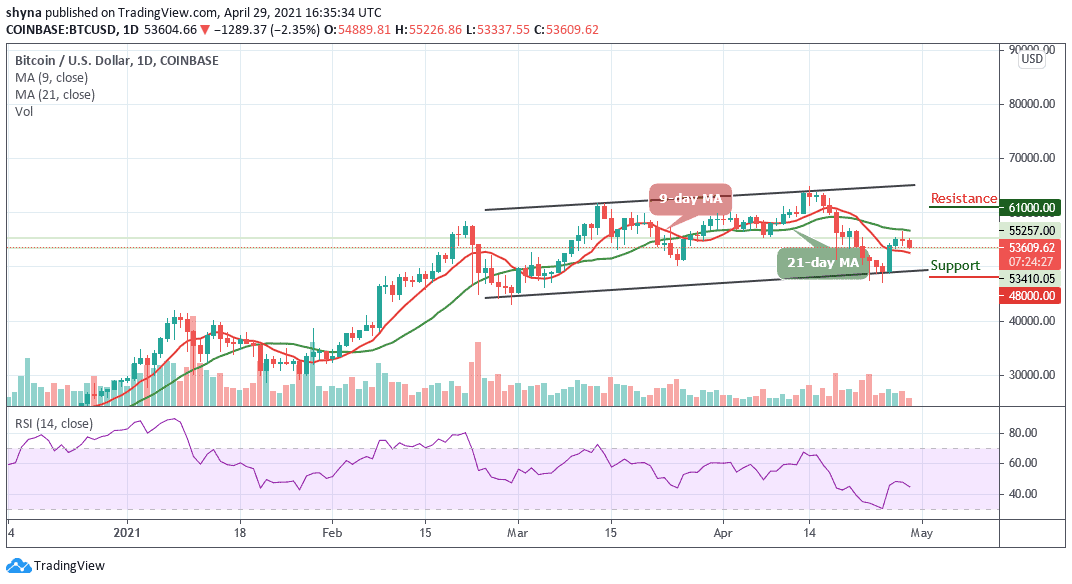
Resistance Levels: $61,000, $63,000, $65,000
Support Levels: $48,000, $46,000, $44,000
At the time of writing, BTC/USD is seeking support above $54,000 to avoid extending the bearish leg to $53,000. The 9-day moving average is also a key level in the mission to avert the losses, perhaps reverse the trend for gains heading to $53,500. Alternatively, the BTC bulls need to find acceptance above the intraday highs of $55,226 to refuel the recovery momentum.
Where is the Bitcoin Price Going Next?
The Bitcoin price is stable within the 9-day and 21-day moving averages as it is currently attempting a downside break below the 21-day moving average. Meanwhile, a close below $53,000 could open the doors for a downtrend in the coming sessions. However, in the past few days, Bitcoin price has been trading in a range above the $45,000 support zone.
More so, BTC/USD is slowly moving lower towards the red-line of 9-day MA. The next key support level may be found at $52,000, below which bears are likely to hit the support at $48,000, $46,000, and $44,000 in the near term as the technical indicator RSI (14) remains below the 50-level.
On the other hand, if there is no clear break below the 9-day MA, there are chances of a bullish movement. Moreover, any further positive movement above the 21-day moving average may likely push the coin to the resistance levels of $61,000, $63,000, and $65,000.
BTC/USD Medium – Term Trend: Ranging (4H Chart)
On the 4-hour chart, a retest of $53,178 gives the impression that bears are not yet done. The Bitcoin price moves below the 9-day and 21-day moving averages as the coin keeps moving sideways. In a short time, BTC/USD may hit $53,000 if the bearish pressure continues. Otherwise, the price may revisit the supports of $50,000 and below.
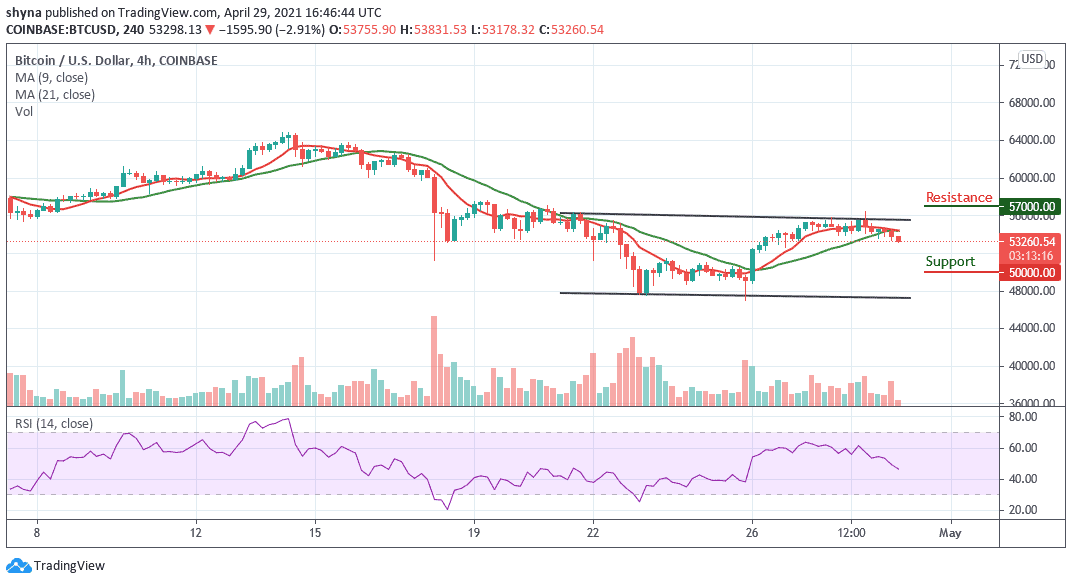
On the upside, a bullish move may hit the resistance at $57,000 and above if the price crosses above the upper boundary of the channel. As of now, the RSI (14) is sliding below the 50-level, this could mean that BTC/USD trading is looking for another close support.