Bitcoin Price Prediction: BTC/USD Slumps Below $55,000, Can Bulls Bounce Back?
Bitcoin (BTC) Price Prediction – April 28
Bitcoin price is struggling to recover above $54,800 as the coin remains at a risk of a larger breakdown below the $50,000 support.
BTC/USD Long-term Trend: Ranging (Daily Chart)
Key levels:
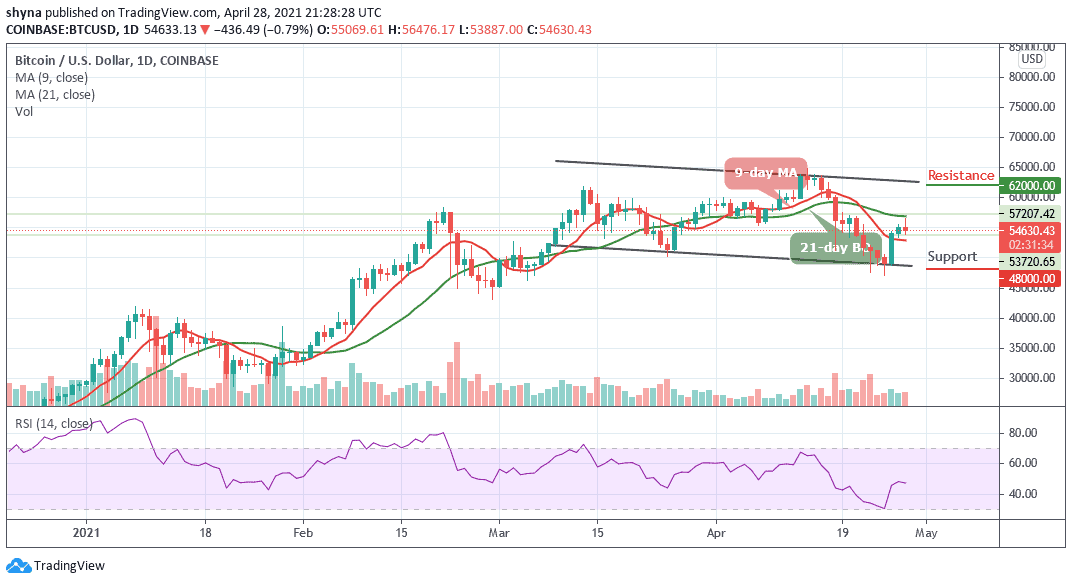
Resistance Levels: $62,000, $64,000, $66,000
Support Levels: $48,000, $46,000, $44,000
BTC/USD bulls are about finding higher support for the king crown. However, the Bitcoin price is back under $55,000 and currently changing hands at $54,630. In this same manner, the price of Bitcoin moves within the 9-day and 21-day moving averages within the channel.
Will BTC Break the Resistance Level of $56,000 or Reverse?
Looking at the daily chart, an upside break above the 21-day MA is a must to start a substantial recovery. Meanwhile, the next hurdles may be seen near the resistance levels of $62,000, $64,000, and $66,000. On the downside, initial support is near the $52,500 level and if there is a successful break below the support level of $50,000, bears are likely to gain strength by bringing the price to a low of $48,000, $46,000, and $44,000 respectively.
Currently, the Bitcoin price is following a sideways movement and a glance at the technical indicator RSI (14) displays a negative picture for BTC in the near term. In addition, maintaining a sideways movement in the negative region, the signal line of RSI (14) is still moving below 50-level, suggesting a bearish signal.
BTC/USD Medium – Term Trend: Ranging (4H Chart)
On the 4-Hour chart, BTC price hovers around $54,840 and may take time to persistently trade above $55,000 as the price crosses below the 9-day moving average. However, if the buyers gather enough strength, the upward movement may be able to near the $58,000 and $60,000 resistance level.
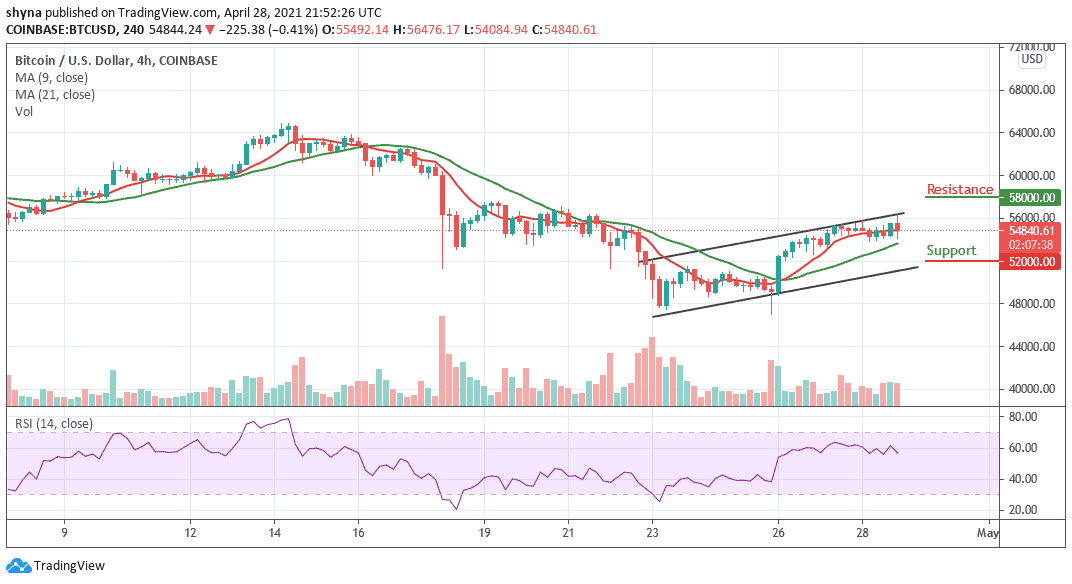
On the downside, the immediate support is around the $53,000 level while the main support is at the $54,000 level. The price may likely slide below the moving averages if the bears step back into the market, a further movement could test the critical support at the $52,000 level and below. Nevertheless, Bitcoin is currently moving in sideways while the technical indicator RSI (14) moves below 60-level, indicating a bearish signal.