Bitcoin Price Prediction: BTC/USD Slows Down Below $55,000; Price Prepares to Retrace
Bitcoin (BTC) Price Prediction – April 28
The Bitcoin price is poised for a retreat to the next support at $54,000 before making another breakout.
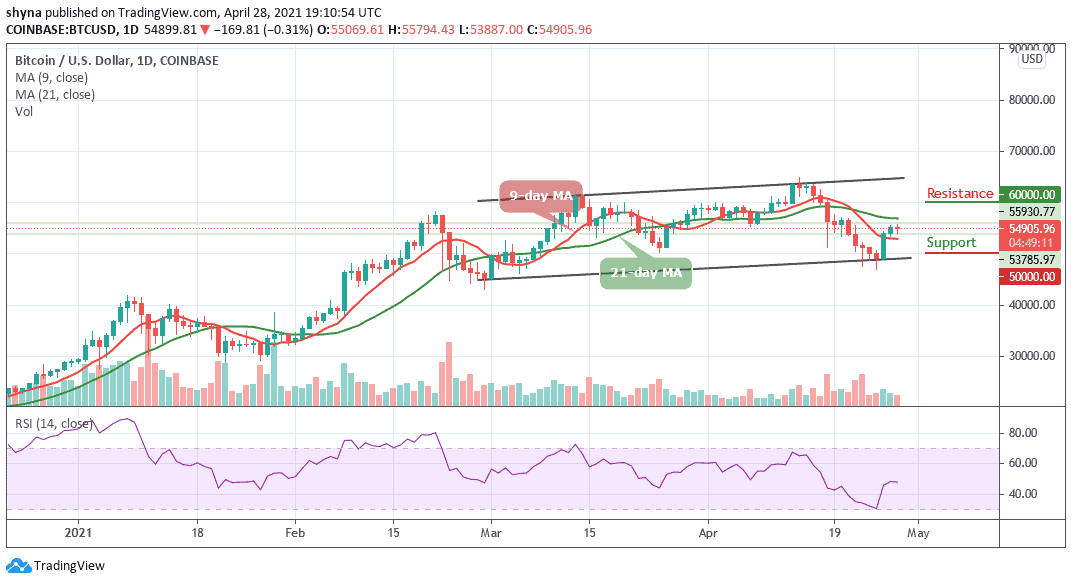
BTC/USD Long-term Trend: Ranging (Daily Chart)
Key levels:
Resistance Levels: $60,000, $65,000, $70,000
Support Levels: $50,000, $45,000, $40,000
BTC/USD is slightly down today after struggling to hold above the critical level of $53,000. This comes following a few bullish days as the first digital asset rebounded from a two-week downtrend, hitting as low as $47,000 on the daily chart. Earlier today, the Bitcoin price is seen trading above the $55,700 level but quickly reversed back down below the next major resistance level at the $54,904 level.
Where is BTC Price Going Next?
The Bitcoin price remains above $54,950 even as bulls seek more support within the 9-day and 21-day moving averages. Looking at the technical indicator RSI (14), BTC/USD is still in the hands of the bulls. However, a minor retreat made by the RSI (14) is making an attempt to trade below 47-level suggesting that exhaustion is slowly engulfing the bullish tent and whatever direction it chooses would determine the next level for the king coin.
Nevertheless, if BTC/USD delays the run-up to $56,000, sellers could eventually gain traction, sending the price back to $53,000 support. Meanwhile, if the support at $51,000 is shattered, BTC/USD may be forced to seek refuge in the next key supports at $50,000, $45,000, and $40,000. On the other hand, any bullish movement above the moving averages could hit the potential resistance levels at $60,000, $65,000, and $70,000 respectively.
BTC/USD Medium – Term Trend: Bearish (4H Chart)
On the 4-Hour chart, the Bitcoin price is trading around the 9-day moving average at the $54,966 level. However, the market price may likely fall below $54,000 if the bears fully stepped back into the market.
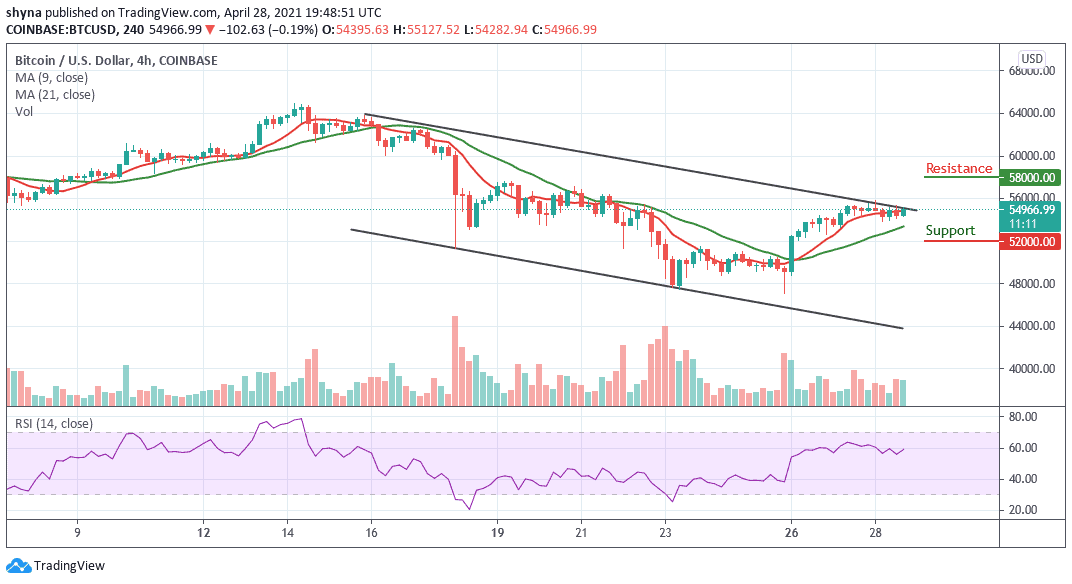
However, a further bearish movement could test the critical support at the $52,000 level and below while the resistance is located above the upper boundary of the channel at $58,000 and above. Technically, Bitcoin is currently following a sideways movement as the technical indicator RSI (14) moves below 60-level.